Fig. 5
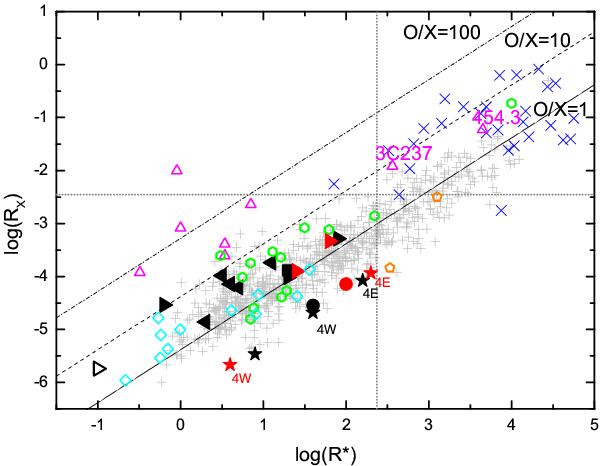
Radio/X-ray vs. radio/optical flux ratio. Diagonal lines indicate optical/X-ray ratios of 1, 10, and 100. Symbol shapes as in Fig. 1. Black symbols are based on our MERLIN measurements. The black open right triangle corresponds to the radio upper-limit-based values of source 13. Red symbols are based on our EVN measurements. The open magenta triangles are data from Ulvestad et al. (2005). Green hexagons are low-luminosity Seyfert 1, 2 galaxies from Panessa et al. (2007), blue crosses radio galaxies from Balmaverde & Capetti (2006). Cyan diamonds are soft X-ray selected NLS1s from Grupe et al. (2004). Light gray plus signs are BLAGN from Li et al. (2008). Japanese VLBI observations of two of them are represented by orange pentagons (Doi et al. 2007). Note that only our data and those of Ulvestad et al. and Doi et al. are based on high angular resolution radio observations. The dotted horizontal and vertical lines mark the refined RL/RQ demarcation from Panessa et al. (2007).
Current usage metrics show cumulative count of Article Views (full-text article views including HTML views, PDF and ePub downloads, according to the available data) and Abstracts Views on Vision4Press platform.
Data correspond to usage on the plateform after 2015. The current usage metrics is available 48-96 hours after online publication and is updated daily on week days.
Initial download of the metrics may take a while.