Fig. 6
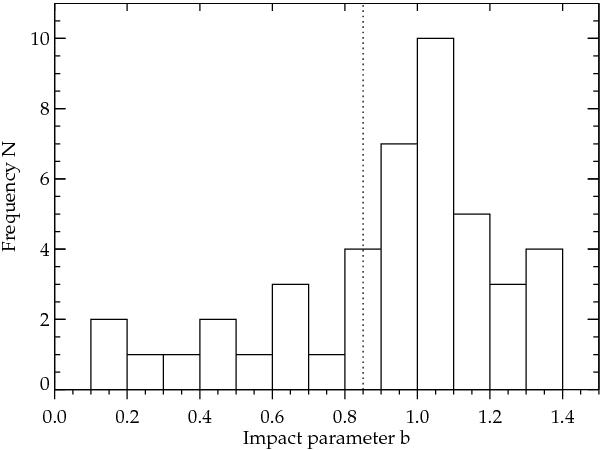
Distribution of fitted impact parameter of the CoRoT IRa01 candidates. The distribution is strongly peaked around b = 1.0, indicating a significant population of (blended) EB contaminants. For a genuine planet distribution we would expect a flat histogram that falls off at high impact parameter. The dotted vertical line indicates the b = 0.85 cutoff we have proposed in this paper.
Current usage metrics show cumulative count of Article Views (full-text article views including HTML views, PDF and ePub downloads, according to the available data) and Abstracts Views on Vision4Press platform.
Data correspond to usage on the plateform after 2015. The current usage metrics is available 48-96 hours after online publication and is updated daily on week days.
Initial download of the metrics may take a while.