Free Access
Fig. 4
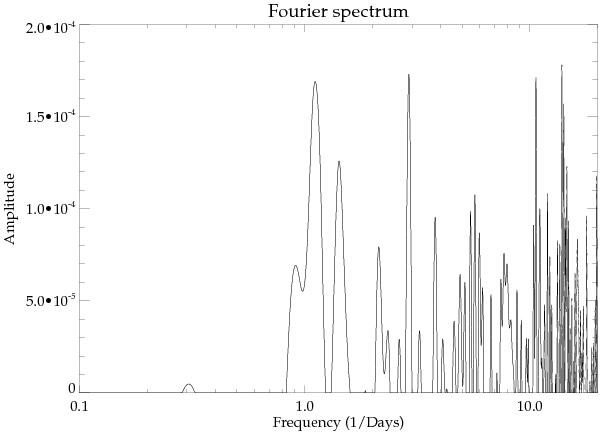
Fourier diagram of an example noise spectrum prior to lightcurve cleaning. Amplitude of the best-fitting sine curve on the vertical axis is plotted against frequency. Peaks around frequencies of 1.0 and ~14 are due to remaining systematics related to the satellite orbit and Earth’s rotational period.
Current usage metrics show cumulative count of Article Views (full-text article views including HTML views, PDF and ePub downloads, according to the available data) and Abstracts Views on Vision4Press platform.
Data correspond to usage on the plateform after 2015. The current usage metrics is available 48-96 hours after online publication and is updated daily on week days.
Initial download of the metrics may take a while.