Fig. 7
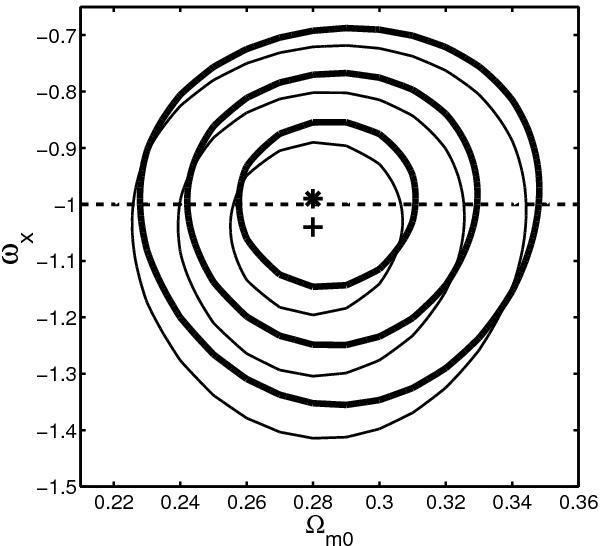
Thick (thin) solid lines are 1, 2, and 3σ constraint contours for the XCDM parametrization from a joint analysis of the BAO and SNeIa (with systematic errors) data, with (and without) the ADD data. The cross (“+”) marks the best-fit point determined from the joint sample without the ADD data at Ωm0 = 0.28 and ωX = −1.04 with  . The star (“ ∗ ”) marks the best-fit point determined from the joint sample with the ADD data at Ωm0 = 0.28 and ωX = −0.99 with
  . The dashed horizontal line at ωX = −1 corresponds to spatially flat ΛCDM models.
Current usage metrics show cumulative count of Article Views (full-text article views including HTML views, PDF and ePub downloads, according to the available data) and Abstracts Views on Vision4Press platform.
Data correspond to usage on the plateform after 2015. The current usage metrics is available 48-96 hours after online publication and is updated daily on week days.
Initial download of the metrics may take a while.