Fig. 5
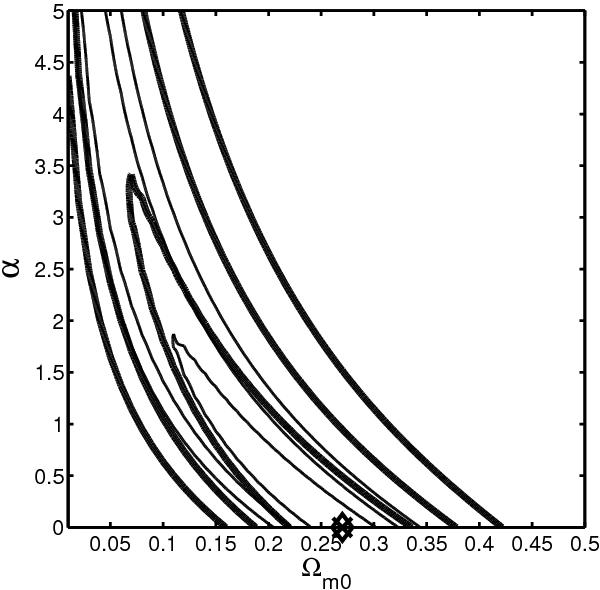
We display the 1, 2, and 3σ constraint contours for the φCDM model from the SNeIa data. The horizontal axis at α = 0 corresponds to spatially flat ΛCDM models. Thin solid lines (best fit at Ωm0 = 0.27 and α = 0.0 with  , marked by “ × ” ) exclude systematic errors, while thick solid lines (best fit at Ωm0 = 0.27 and α = 0.0 with
  , marked by “♢”) account for systematics.
Current usage metrics show cumulative count of Article Views (full-text article views including HTML views, PDF and ePub downloads, according to the available data) and Abstracts Views on Vision4Press platform.
Data correspond to usage on the plateform after 2015. The current usage metrics is available 48-96 hours after online publication and is updated daily on week days.
Initial download of the metrics may take a while.