Fig. 4
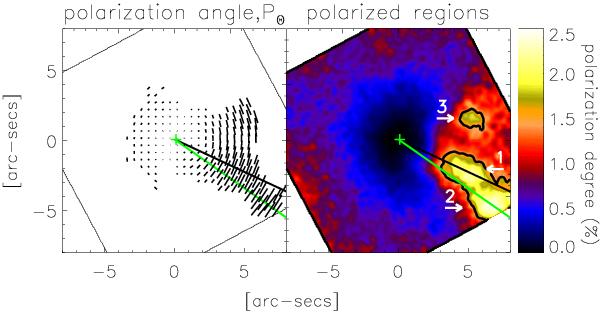
Degree of polarization of Z CMa. North is up, east is left. The black and green lines show the trajectories of the large jet and micro-jet, respectively. The green cross shows the position of the binary; the separation of the stars is smaller than the size of the symbol. Left: PΘ is shown by the vectors. Only regions of the image with an S/N higher than 3 are displayed in this image. The length of the vectors is proportional to the local degree of polarization. Right: P image smoothed by convolution with a Gaussian kernel of 5 pixels. The black contours indicate the regions of the image where P is higher than 1.5%. The three arrows indicate the three regions of the image discussed in Sect. 4.
Current usage metrics show cumulative count of Article Views (full-text article views including HTML views, PDF and ePub downloads, according to the available data) and Abstracts Views on Vision4Press platform.
Data correspond to usage on the plateform after 2015. The current usage metrics is available 48-96 hours after online publication and is updated daily on week days.
Initial download of the metrics may take a while.