Fig. 3
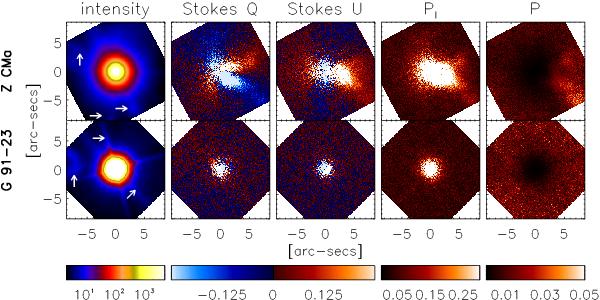
Comparison of Z CMa (top row) and G 91-23 (unpolarized, diskless star, bottom row). North is up and east is left in all images. Starting from the left, the first column shows the total intensity image in logarithmic scale. The arrows indicate the position of different instrumental artifacts. The second and third column show the Stokes Q and U parameters, respectively. The polarized intensity (PI) is shown in the fourth column. G 91-23 shows a pattern caused by remnant, uncorrected, noise. Z CMa shows an extended, asymmetrical structure, with two extended features toward west and southwest. The fifth column shows the degree of polarization (P). The units of the color bars are given in CCD-counts, except in the case of P, where the degree (%) of polarization is shown. Our polarized images are calibrated in a reference system fixed to the observed object (see Sect. 2).
Current usage metrics show cumulative count of Article Views (full-text article views including HTML views, PDF and ePub downloads, according to the available data) and Abstracts Views on Vision4Press platform.
Data correspond to usage on the plateform after 2015. The current usage metrics is available 48-96 hours after online publication and is updated daily on week days.
Initial download of the metrics may take a while.