| Issue |
A&A
Volume 543, July 2012
|
|
|---|---|---|
| Article Number | A122 | |
| Number of page(s) | 8 | |
| Section | Stellar structure and evolution | |
| DOI | https://doi.org/10.1051/0004-6361/201117619 | |
| Published online | 09 July 2012 | |
Search for radio pulsations in LS I +61 303
1 Departament d’Astronomia i MeteorologiaInstitut de Ciències del Cosmos (ICC), Universitat de Barcelona (IEEC-UB), Martí i Franquès 1, 08028 Barcelona Spain
e-mail: acanyelles@am.ub.es; jmoldon@am.ub.es; vzabalza@am.ub.es; mribo@am.ub.es; jmparedes@ub.edu
2 National Centre for Radio Astrophysics, Post Bag 3, Ganeshkhind, 411007 Pune, India
e-mail: bcj@ncra.tifr.res.in; ishwar@ncra.tifr.res.in
3 Max-Planck-Institut für Kernphysik, Saupfercheckweg 1, 69117 Heidelberg, Germany
e-mail: Victor.Zabalza@mpi-hd.mpg
4 Departamento de Física (EPSJ), Universidad de Jaén, Campus Las Lagunillas s/n, 23071 Jaén, Spain
e-mail: jmarti@ujaen.es
Received: 1 July 2011
Accepted: 23 May 2012
Context. LS I +61 303 is a member of the select group of gamma-ray binaries: galactic binary systems that contain a massive star and a compact object, show a changing milliarcsecond morphology and a similar broad spectral energy distribution (SED) that peaks at MeV–TeV energies and is modulated by the orbital motion. The nature of the compact object is unclear in LS I +61 303, LS 5039 and HESS J0632+057, whereas PSR B1259–63 harbours a 47.74 ms radio pulsar.
Aims. A scenario in which a young pulsar wind interacts with the stellar wind has been proposed to explain the very high energy (VHE, E > 100 GeV) gamma-ray emission detected from LS I +61 303, although no pulses have been reported from this system at any wavelength. We aim to find evidence of the pulsar nature of the compact object.
Methods. We performed phased array observations with the Giant Metrewave Radio Telescope at 1280 MHz centred at phase 0.54. Simultaneous data from the multi-bit phased array back-end with a sampling time of tsamp = 128 μs and from the polarimeter back-end with tsamp = 256 μs where taken.
Results. No pulses have been found in the data set, with a minimum detectable mean flux density of ~0.38 mJy at 8-σ level for the pulsed emission from a putative pulsar with period P > 2 ms and duty cycle D = 10% in the direction of LS I +61 303.
Conclusions. The detection of posible radio pulsations will require deep and sensitive observations at frequencies ~0.5–5 GHz and orbital phases 0.6−0.7. However, it may be unfeasible to detect pulses if the putative pulsar is not beamed at the Earth or if there is a strong absorption within the binary system.
Key words: binaries: close / gamma rays: stars / pulsars: general / radio continuum: stars / stars: individual: LS I +61 303 / X-rays: binaries
© ESO, 2012
1. Introduction
Located at a distance of 2.0 ± 0.2 kpc (Frail & Hjellming 1991), LS I +61 303 contains a rapidly rotating B0 Ve star with a stable equatorial shell, and a compact object of unknown nature with a mass between 1 and 5 M⊙, orbiting it every 26.5 days (Hutchings & Crampton 1981; Casares et al. 2005a). Optical and IR orbital modulation have been found (Mendelson & Mazeh 1994; Paredes et al. 1994). Using radial velocities data, Casares et al. (2005a) found that the orbit is eccentric (e ≃ 0.72) and periastron takes place at phase 0.23 ± 0.02, taking T0 = JD 2 443 366.775. More recently Aragona et al. (2009) stated that the eccentricity is slightly lower (e ≃ 0.54) and the phase of the periastron passage is 0.275. The compact object would be a neutron star for inclinations 25° ≲ i ≲ 60° and a black hole if i ≲ 25° (Casares et al. 2005a). However, there are discrepancies between the proposed orbital solutions by Casares et al. (2005a) and Aragona et al. (2009), and the inclination angle is poorly constrained by radial velocities of the companion star alone.
Quasi-periodic radio outbursts monitored during 23 years have provided an accurate orbital period value of 26.4960 ± 0.0028 d (Gregory 2002). The maximum of the radio outbursts varies between phase 0.45 and 0.95.
Orbital X-ray periodicity has also been found (Paredes et al. 1997; Harrison et al. 2000; Torres et al. 2010). Similar results have been obtained at higher energies with INTEGRAL data (Hermsen & Kuiper 2006; Zhang et al. 2010). LS I +61 303 is also spatially coincident with a high energy (HE, E > 100 MeV) gamma-ray source detected by EGRET (Kniffen et al. 1997).
The Fermi Space Telescope Large Area Telescope (Fermi/LAT) reported the first detection of the orbital modulation at HE with a period of 26.6 ± 0.5 days roughly anti-correlated with the X-ray emission (Abdo et al. 2009a).
At very high energy (VHE, E > 100 GeV) gamma rays, LS I +61 303 was detected by the MAGIC Cherenkov telescope (Albert et al. 2006) and confirmed by the VERITAS stereoscopic array (Acciari et al. 2009a). Further observations by the MAGIC collaboration led to the discovery of the orbital variability of TeV emission with a period of 26.8 ± 0.2 days (Albert et al. 2009). Simultaneous observations of MAGIC and the XMM-Newton and Swift X-ray satellites revealed a correlation between the X-rays and VHE bands (Anderhub et al. 2009).
Massi et al. (2004) reported the discovery of an extended jet-like and precessing radio emitting structure at angular extensions of 10–50 milliarcsec. Owing to the presence of apparently relativistic radio emitting jets, LS I +61 303 was proposed to be a microquasar. However, Very Long Baseline Array (VLBA) images obtained during a full orbital cycle show a rotating elongated morphology (Dhawan et al. 2006), which may be consistent with a model based on the interaction between the relativistic wind of a young non-accreting pulsar and the wind of the donor star (Maraschi & Treves 1981; Dubus 2006). On 2008 September 10, the Swift Burst Alert Telescope (BAT) detected a hard X-ray burst in the direction of LS I +61 303 which, assuming the association, would be the signature of a magnetar-like activity that has been proposed to be linked to the presence of a young highly magnetized pulsar in the binary system (Dubus & Giebels 2008). The Fermi/LAT spectrum is compatible with a power law and an exponential cutoff at ~ 6 GeV, suggesting that there are two separate spectral components for the HE and VHE emission. Moreover, the spectral similarity with gamma-ray pulsars leads to the consideration of a magnetospheric origin for this HE component despite the fact that no pulses have been detected and although the orbital modulation would be unexpected in this scenario (Abdo et al. 2009a; Pétri & Dubus 2011). This orbital variability could be understood in the framework of inverse Compton scattering of photon fields in a striped pulsar wind model, which predicts pulsed and variable HE emission (Pétri & Dubus 2011). In any case, from an observational point of view it is not clear yet if LS I +61 303 contains an accreting black hole, an accreting neutron star or a non-accreting neutron star.
In addition to LS I +61 303, three binary systems that contain a massive star and a compact object and display extended radio emission have been clearly detected at VHE: PSR B1259–63, LS 5039 and HESS J0632+057. These four systems have a similar spectral energy distribution (SED; Dubus 2006; Hinton et al. 2009), peaking at MeV–GeV energies, and thus are considered gamma-ray binaries. Whereas the nature of the compact object in LS I +61 303, LS 5039 and HESS J0632+057 remains unknown, PSR B1259–63/LS 2883 is the only gamma-ray binary with a confirmed pulsar (Johnston et al. 1992). This binary system contains an O9.5 Ve (Negueruela et al. 2011) donor and a 47.74 ms radio pulsar orbiting it every 3.4 years in a very eccentric orbit with e = 0.87 (Johnston et al. 1992; Johnston et al. 1994). The radio light curve of the unpulsed emission of PSR B1259–63 is well explained by the adiabatic expansion of a synchrotron bubble, which is similar to the behaviour found in LS I +61 303. Pulsed radio emission is detected with a spectral index of about − 0.6, although the radio pulses vanish for some weeks during the periastron passage (Connors et al. 2002; Johnston et al. 2005) probably due to free-free absorption by the stellar wind and interaction with the Oe-star disk. Note that in the case of LS I +61 303 the apastron separation is smaller than the periastron separation for PSR B1259–63, therefore detecting pulses from LS I +61 303 is unlikely even if the pulsar exists and is beamed at the Earth. The system was detected by HESS in the 2004 and 2007 periastron passages (Aharonian et al. 2005, 2009). Extended and variable radio emission at milliarcsecond scales, outside the binary system, was observed after the 2007 periastron passage of PSR B1259–63 (Moldón et al. 2011a). This is the first observational evidence that a non-accreting pulsar orbiting a massive star can produce a milliarcsecond radio structure similar to those of LS I +61 303, LS 5039 and HESS J0632+057.
As in the case of LS I +61 303, the nature of the compact object in LS 5039 is unknown: it is either a black hole or a neutron star with a mass between 1.5 and 10 M⊙ in a slightly eccentric (e = 0.35) 3.9-day orbit around an O6.5 V((f)) star located at 2.5 kpc (Casares et al. 2005b; Aragona et al. 2009). Similarly to LS I +61 303 and PSR B1259–63, LS 5039 also shows X-rays, HE and VHE emission modulated by the orbit (Takahashi et al. 2009; Abdo et al. 2009b; Aharonian et al. 2006, respectively). The discovery of a bipolar extended milliarcsecond radio emission morphology with VLBA observations prompted a microquasar interpretation (Paredes et al. 2000), but additional VLBA observations revealed a changing behaviour of the morphology that cannot easily be explained by a microquasar scenario (Ribó et al. 2008). Rea et al. (2011) performed recently a deep search for pulsations from LS 5039 with Chandra, finding no periodic signals in a frequency range of 0.005–175 Hz.
HESS J0632+057 has recently joined the short list of gamma-ray binaries. Moldón et al. (2011b) reported the slightly extended and variable radio milliarcsecond structure of HESS J0632+057 at 1.6 GHz with the e-EVN. It is positionally coincident with a B0pe star and the X-ray source XMMU J063259.3+054801 (Hinton et al. 2009), which is also variable (Acciari et al. 2009b). Bongiorno et al. (2011) have recently confirmed its binary nature by the discovery of a periodicity of 320 ± 5 days in a 0.3–10 keV light curve obtained with Swift. This faint and point-like VHE source was first detected in the HESS Galactic Plane Survey (Aharonian et al. 2007). HESS J0632+057 is clearly variable also at VHE: 2006–2007 and 2008–2009 observations by VERITAS imposed flux upper limits well below the values detected by the HESS Galactic Plane Survey (Acciari et al. 2009b), and afterwards higher TeV gamma-ray emission was detected by VERITAS (Ong 2011) and MAGIC (Mariotti 2011). No pulses have been detected at any wavelength from HESS J0632+057 (Rea & Torres 2011).
Overall, there are many similarities between PSR B1259–63 and the other three known gamma-ray binaries (LS I +61 303, LS 5039 and HESS J0632+057), but no pulsations have been detected up to now in the latter. In this paper we report our search for radio pulsations from LS I +61 303. In Sect. 2 we present the situation of the searches for pulsations from LS I +61 303 before our work. In Sect. 3 we describe how we selected the orbital phase of the observation and the frequency in order to minimise the effect of absorption and pulse broadening in the observations described in Sect. 4. We describe the data analysis in Sect. 5. The results are presented in Sect. 6, where we describe the implications for future observations. In Sect. 7 we discuss these results and present our conclusions.
2. Previous searches of pulsations
To our knowledge, only two limited searches for evidence of a pulsar in LS I +61 303 were reported in refereed journals before our observations. Coe et al. (1982) recorded 10.7-GHz radio data with a time resolution of ~15 s, but no evidence of short-term periodicities was found in the range 28–4200 s. The only observational hint of pulsed emission has been the discovery by Peracaula et al. (1997) of a ~1.4 h periodicity in a series of ~4 mJy microflares active during 8 h in a 5 GHz VLA radio observation. McSwain et al. (2011) recently reported on GBT observations placing deep upper limits between 4.1 and 14.5 μJy at C, S and X bands.
LS I +61 303 does not appear as a radio pulsar in any of the public catalogues built after performing blind pulsar searches. LS I +61 303 has a relatively high dispersion measure (DM): the NE2001 electron density model (Cordes & Lazio 2002) gives DM = 60 ± 10 pc cm-3 in the direction and distance to LS I +61 303 (d = 2.0 ± 0.2 kpc). As shown in Appendix A, the pulse broadening is also considerable at low frequencies.
The Green Bank and Jodrell Bank observatories have performed pulsar surveys pointing to the LS I +61 303 region. The Green Bank short-period survey conducted by Stokes et al. (1985) used a sampling time of 2 ms. These authors computed a minimum detectable flux density of ~100 mJy for a period of ~4 ms, or ~2 mJy for P > 100 ms. More recently, the GBT350 Survey of the Northern Galactic Plane for Radio Pulsars and Transients, using a fast sampling time (tsamp = 81.92 μs), attained a ~2 mJy sensitivity for normal, slow pulsars (Hessels et al. 2008; this sensitivity should be extendible to 10−100 ms pulsars with moderate DMs, Hessels, priv. comm.).
In the case of Jodrell Bank, Clifton & Lyne (1986) claimed a sensitivity of ~1 mJy (considering a 6σ detection threshold) for a pulsar with a duty cycle of 4% for the Jodrell Bank B survey.
The surveys of Molonglo, Parkes and Swinburne were made from the southern hemisphere, at latitudes where LS I +61 303 is not visible. LS I +61 303 is outside the range of available declinations for Arecibo.
At other wavelenghts, deep Chandra observations performed by Rea et al. (2010) did not exhibit X-ray pulses. Despite showing a HE spectrum similar to those observed in gamma-ray pulsars, Fermi/LAT has not reported pulsed gamma-ray emission either. However, the lack of good orbital ephemeris and an a priori knowledge on the putative pulsar period hinders the search in the currently available Fermi/LAT data.
3. Minimising absorption
LS I +61 303 is an eccentric binary system in which the proximity of the Be star to the compact object should cause a significant free-free absorption of the putative pulsar radio emission. This is strongly modulated along the orbit through the pronounced eccentricity of the system. In our model we consider the effect of free-free absorption with the stellar wind of the massive star, and we ignore the interaction with the circumstellar disk because it is truncated at 34–37 R⊙, much lower than the distance at the considered orbital phase. We consider a smooth and continuous stellar wind as a first-order approximation although a realistic wind is affected by turbulence and may be clumpy. We do not discuss other possible influences of the Tsytovitch-Razin effect and the synchrotron self-absorption (see for instance Hornby & Williams 1966; White & Chen 1995; Dougherty et al. 2003). Other effects may be important, as discussed in Thompson et al. (1994), such as refraction of the radio beam, pulse smearing, and induced Compton scattering. These effects are unknown due to the lack of information about the putative pulsar properties and the conditions of the plasma surrounding it.
Because we aimed to observe at the orbital phase with a minimum absorption, we computed the optical depth towards the compact object at different orbital phases and for different frequencies using the Rosseland mean opacity (see Dubus 2006): ![\begin{eqnarray} \tau \simeq 0.3 &\times & \left[ \frac{\dot{M_\mathrm{W}}}{10^{-8}\,M_{\odot}\,\mathrm{yr^{-1}}}\right] ^{2} \times \left[ \frac{v_\mathrm{W}}{2000\,\mathrm{km\,s^{-1}}}\right] ^{-2} \nonumber \\ & \times & \left[ \frac{T}{10^4\,\mathrm{K}}\right] ^{-3/2} \times \left[ \frac{\nu}{\mathrm{GHz}}\right] ^{-2} \times \int_{l_0}^\infty r^{-4}{\rm d}l . \label{eq:tau} \end{eqnarray}](/articles/aa/full_html/2012/07/aa17619-11/aa17619-11-eq37.png) (1)The assumed parameters for the Be star are a mass-loss rate of Ṁw = 10-8 M⊙ yr-1 (Howarth & Prinja 1989), a terminal wind speed of vw,∞ = 1750 km s-1 (Hutchings 1979) and a β-law with β = 0.8 (Puls et al. 1996), and a temperature of T = 28 000 K (Casares et al. 2005a). Distances are in astronomical units. We integrated along the line-of-sight path from the position of the compact object (l0) up to the observer at ∞. We have considered the orbital parameters in Casares et al. (2005a). Since we are assuming that the compact object is a neutron star, we used 1.4 M⊙ for its mass. Hence, the mass function implies an inclination angle i = 65°, which is slightly out but not very far of the rough limit of 60° imposed by the lack of clear shell lines in Casares et al. (2005a). Note that these assumptions in the stellar wind and the choice of the orbital parameters plays an important role in the resulting absorption.
(1)The assumed parameters for the Be star are a mass-loss rate of Ṁw = 10-8 M⊙ yr-1 (Howarth & Prinja 1989), a terminal wind speed of vw,∞ = 1750 km s-1 (Hutchings 1979) and a β-law with β = 0.8 (Puls et al. 1996), and a temperature of T = 28 000 K (Casares et al. 2005a). Distances are in astronomical units. We integrated along the line-of-sight path from the position of the compact object (l0) up to the observer at ∞. We have considered the orbital parameters in Casares et al. (2005a). Since we are assuming that the compact object is a neutron star, we used 1.4 M⊙ for its mass. Hence, the mass function implies an inclination angle i = 65°, which is slightly out but not very far of the rough limit of 60° imposed by the lack of clear shell lines in Casares et al. (2005a). Note that these assumptions in the stellar wind and the choice of the orbital parameters plays an important role in the resulting absorption.
With these opacities we have estimated the absorbed pulsed flux densities as a function of the unabsorbed pulsed flux density S0 at 1.3 GHz,  (2)at different frequencies and for several values of the spectral index (α, defined as S ∝ να): α = −0.5 (a very flat spectrum), − 1.0 (an intermediate value) and − 2.0 (a steep spectrum). In Fig. 1 we show the expected pulsed flux densities for α = −1.0 for different frequencies. The modelled flux density variability of the pulsed emission at a given frequency is entirely due to the change in the the optical depth along the orbit. We conclude that the best orbital phase range to try to detect pulsations in LS I +61 303 is ~0.6−0.7, and the highest absorbed flux densities assuming α = −1.0 would be received at ~0.5−2 GHz. In Fig. 2 we plot the opacity for typical values of the stellar parameters. We can see that, under the conditions considered here, the opacity is around or below 1 at the orbital phase range mentioned above.
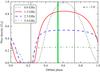 |
Fig. 1 Expected LS I +61 303 pulsed flux density along the orbit at different frequencies for α = − 1.0 assuming that the intrinsic pulsed flux density at 1.3 GHz is S0 and considering free-free absorption effects. Periastron and apastron are indicated by the vertical black lines at phases 0.23 and 0.73, respectively. The highest observable flux density is expected to occur at 0.6 GHz at orbital phase ~0.6−0.7, three days before apastron. The observation phase range of this work is indicated by the vertical green stripe centred at 0.54. |
 |
Fig. 2 Optical depth in logarithmic scale (colour bar) for different combinations of stellar parameters at orbital phase 0.54. The dependence with the system inclination, i, in the wide range 15–90° (Casares et al. 2005a) is very low at this orbital phase, although it is strong around periastron. The terminal wind velocity is plotted between 600 km s-1 (wind velocity at the equator in McSwain et al. 2011) and 2000 km s-1. The expected stellar temperature ranges from 21 500 K McSwain et al. (2011) to 30 000 K. Casares et al. (2005a) estimated the stellar mass to be between 10 and 15 M⊙. The black circles mark the values adopted in this paper. |
Parameters of the four known pulsars from ATNF when available.
4. Observations
The Giant Metrewave Radio Telescope (GMRT) is an array of 30 fully steerable 45 m diameter parabolic dish antennas. It is located at 19°6′ N, 74°3′ E, at a height of 650 m above the sea level, around the village of Khodad, 80 km north of Pune (India). Fourteen antennas are distributed in a 1000 m central core and the remaining are arranged along three ~14 km-long arms.
Phased array observations were performed around midnight between 2009 July 2 and 3 (UTC), centred at phase 0.54. Three observations of LS I +61 303 were carried out, lasting 171 min (21:31:45–23:22:16 UT), 123 min (00:52:04–03:01:02 UT) and 34 min (03:09:35–03:43:06 UT), i.e., a total of 5.47 h. The array was phased on 3C 48 twice: the first time before any pulsar observation, and the second time between the first and the second pointing on LS I +61 303. We decided to observe at 1280 MHz to minimise the effect of absorption (see Sect. 3) and avoid the pulse broadening (see Appendix A) and radio frequency interferences (RFI), which are more often present at lower frequencies. Because we aimed for a good phase coherence between antennas, we did not use the farthest three antennas in each arm. Data from two polarisations were taken in a bandwidth of 32 MHz centred at 1280 MHz divided into two subbands, the upper side band (USB, from 1280 to 1296 MHz) and the lower side band (LSB, 1264 to 1280 MHz), each split into 256 channels. Three back-ends were used simultaneously: the multi-bit phased array back-end (PA), which is specifically conceived for pulsar observations, at USB, the polarimeter (PMT) at USB and the PMT at LSB. This redundancy is convenient because each back-end introduces different noise features and this allows cross-checking. The PA sampling time was chosen to be tsamp = 128 μs, and tsamp = 256 μs for both PMTs.
With the aim of checking the performance behaviour and data quality, we observed four known pulsars: PSR B0329+54, PSR B1937+21, PSR B2022+50, and PSR B2035+36. This group of pulsars covers a wide range of the parameters space, e.g. periods ranging from 1.56 to 715 ms and fluxes from 0.8 to 203 mJy. In Table 1, obtained from the ATNF Pulsar Catalogue1 (Manchester et al. 2005), we show the period (P), the dispersion measure (DM), the pulse width at 50% (W50) and 10% (W10) of the flux density peak, the mean flux density at 1400 MHz ( ) and the spectral index.
We used the four known pulsars to compare the expected and the obtained S/N in a manner similar to that described in Joshi et al. (2009). In Table 2 we show the expected and obtained S/N in our observations, as well as the ratios between both values, for each of the four known pulsars. The expected S/N were computed using  (3)where Smean is the mean flux density in Jy, β is a dimensionless constant that accounts for the losses in the digitisation of the received analogue signal, Tsys = Treceiver + Tsky + Tground is the total system temperature in Kelvin, G is the single antenna gain in K Jy-1, Na is the number of antennas, Np is the number of orthogonal polarisations, t is the integration time in s, Δν is the bandwidth in Hz, and D is the duty cycle defined as D =
  , where W is the width of the pulses and P their periodicity.
As explained above, we used Np = 2 and Δν = 16 MHz. We considered β = 1/0.8, Tsys = 73 K and G = 0.22 K Jy-1 following the GMRT System Parameters and Current Status2 document. The mean flux density at 1280 MHz was computed using and α from Table 1 when α was available and assuming α = − 1.8 for PSR B1937+21. We used 20 antennas at USB and 18 at LSB during the observations before 3:02 UT (PSR B1937+21, PSR B2022+50, PSR B2035+36 and the first two observations on LS I +61 303) and one antenna less for the remaining observations (PSR B0329+54 and the last observation on LS I +61 303). The duty cycle was computed as D =
  when W10 was available. For PSR B2035+36 we used D =
  instead.
The ratio of expected S/N versus obtained S/N should be greater than unity because Eq. (3) does not model all error sources. This ratio can be much higher than 1 if the data are affected by corruption due to RFI and deviation from phasing over time. In order to take this into account we scaled the sensitivity of LS I +61 303 observations using a parameter that averages the expected over obtained S/N, which we will call the correction factor K. Hence, the minimum detectable mean pulsed flux density is given by 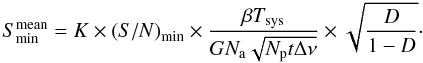 (4)It can be seen in Table 2 that the LSB data have a lower S/N (both expected and obtained) than the USB data. This is mainly because two antennas less were used in LSB than in USB. Added to this, the PA data have a shorter sampling time than PMT (128 μs versus 256 μs), we conclude that the PA data are the most suitable to detect pulses from LS I +61 303.
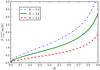 |
Fig. 3 Flux density upper limits in mJy in the direction of LS I +61 303 obtained with Eq. (4) for increasing values of the duty cycle and for different values of the correction factor K for the PA data. |
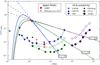 |
Fig. 4 Upper limit of 0.38 mJy extended to the radio wavelengths considering α = − 0.5 (black lines), α = − 1.0 (green lines) and α = − 2.0 (blue lines). Dashed lines do not consider any absorption, while solid lines are affected by free-free absorption using Eqs. (1) and (2) and considering the orbital position at which the absorption is lowest (phase 0.61). Note that no intrinsic low-frequency cutoff has been introduced. Ten-hour potential sensitivities are plotted for the LOFAR (pentagon), GBT (triangles), Effelsberg (stars), EVLA (circles) and ALMA (diamonds) observatories. For the two latter, empty symbols are plotted using a reduced bandwidth of Δν = 800 MHz. |
Table 2 shows that PSR B0329+54 has a much higher value of the expected over obtained ratios compared to the other pulsars. Since PSR B0329+54 is extremely bright, this result is probably reflecting a dynamic range problem. We do not expect LS I +61 303 to emit extremely bright pulses, therefore we did not consider PSR B0329+54 when computing the correction factor K.
For pulsar PSR B2035+36 the expected over obtained ratio is the lowest in each back-end. W10 is unknown for this pulsar; this can lead to a wrong estimation of S/N. Moreover, PSR B2035+36 is very faint, near detection threshold, which can yield a wrong value of the obtained S/N. We decided not to include PSR B2035+36 in the estimation of the correction factor K.
For these reasons we computed K by averaging only over PSR B1937+21 and PSR B2022+50 (see values in Table 2). The result is K ≃ 3.8 for the PA data and K ≃ 2.9 for the PMT USB data.
5. Analysis
The data of LS I +61 303 were analysed using the publicly available pulsar analysis package SIGPROC3 adapted for the GMRT data format. The data were first examined for radio frequency interference (RFI) by estimating the distribution of powers over the whole time series. Any outliers to the expected Gaussian distribution were clipped. The resulting 256-channel data for a sideband were dedispersed to 256 trial dispersion measures (DM-integrated electron column density in the line of sight) ranging from 0 to 1000 pc cm-3. The Fourier transform of the dedispersed time series for each trial DM was then computed and up to 32 harmonics in the resulting spectrum were summed. Any periodicity above eight times the signal-to-noise ratio in the summed spectrum was recorded. After ignoring the known interference periodicities, the data were folded at candidate periodicities to produce eight 2-MHz subbands and eight subintegrations over the entire observations as well as the total average profile, which were plotted as a composite plot. These plots were manually examined for all candidate periodicities, which were all rejected because their DM profiles suggested a terrestrial origin and they were not visible in all subintegrations (i.e., they were not present during all observations). Hence, no pulsed emission from LS I +61 303 was detected, which places a strict upper limit on the absorbed pulsed emission from this binary system.
6. Results and implications
A pulsed signal with expected DM for LS I +61 303 was not detected. Considering K = 3.8, t = 3 h, a (S/N)min = 8, and a canonical duty cycle of 10% in Eq. (4) we obtained an upper limit of 0.38 mJy for the radio pulse mean flux density from a putative pulsar with P > 2 ms in the direction of LS I +61 303 for the PA USB data from GMRT. In Fig. 3 we show the minimum mean flux density detectable in our observations for different values of the duty cycle and the correction factor K. For the PMT USB data the correction factor is K ≃ 2.9 and the corresponding upper limit is 0.27 mJy for pulses with P > 5 ms.
We show in Fig. 4 our obtained upper limit of 0.38 mJy at 1.28 GHz and the corresponding upper limits as a function of frequency for different spectral indexes including absorption (solid lines) and without absorption (dashed lines). In this plot we also show the upper limits obtained by McSwain et al. (2011), even though the observations were not performed at the same orbital phase and the sensitivities were computed using different methods. We plotted potential ten-hour sensitivities for five observatories for future observations planning: the Low Frequency Array (LOFAR) considering the HBA; the Green Banck Telescope (GBT) using the GBT Ultimate Pulsar Processing Instrument (GUPPI) and, for comparison, the GBT350 Survey sensitivity; the Effelsberg 100-m Radio Telescope considering the surveys presented in Klein et al. (2004); the Expanded Very Large Array (EVLA); and the Atacama Large Millimeter/submillimeter Array (ALMA). For EVLA and ALMA, we considered a putative pulsar back-end with a full bandwidth and a reduced bandwidth (Δν = 800 MHz as for GUPPI), Np = 2 and β = 1. We have considered the most favourable conditions, and hence these estimates must be considered lower limits to the minimum mean flux density of a detectable pulsar in a ten-hour observation in the LS I +61 303 direction. The duty cycle is assumed to be D = 10% and in the case of the GBT it has been corrected of pulse broadening as explained in Appendix A.
Looking at Fig. 4 it becomes evident that LOFAR operates in a zone where pulses from LS I +61 303 would be totally absorbed, and pulse broadening is very important if the putative pulsar is fast. In the other extreme of the radio spectrum, a ten-hour observation with ALMA would be interesting only in the case of a very flat intrinsic spectrum. It would be better to observe at the favoured frequency zone from 0.5 to 5 GHz, especially in case of a steep spectrum. The Effelsberg telescope operates in this frequency range and would provide good sensitivities. According to Fig. 4, the EVLA would be capable to detect the lowest flux densities, but these sensitivities are computed using many assumptions, considering future planned capabilities and an unplanned pulsar back-end with assumed specifications. On the other hand, GBT enjoys the good performance of GUPPI. Furthermore, the minimum of the GBT curve is at lower frequencies, precisely at the few GHz favoured zone. In this context, we note that a high-frequency search for pulsations from LS I +61 303 has been performed with GBT around orbital phase 0.9, where absorption effects are not important at these frequencies according to our model, placing deep upper limits between 4.1 and 14.5 μJy at bands S, C and X (McSwain et al. 2011).
7. Discussion and conclusions
Detection of pulses is the only definitive way to confirm the pulsar nature of the compact object in LS I +61 303. We have performed phased array observations with the GMRT at 1280 MHz in the LS I +61 303 direction centred at phase 0.54, from 21:31:45 2009 July 2 UT to 03:43:06 2009 July 3 UT. No pulses have been found in the data set, with a minimum detectable flux density of around 0.38 mJy for periods greater than 2 ms and a duty cycle of 10%. If LS I +61 303 had the same duty cycle as PSR B1259–63 (63%), the upper limit would be 1.3 mJy (see Fig. 3), which is below the ~5 mJy mean flux density of this pulsar at this frequency (Johnston et al. 2005). These results give a guide for future observations planning, which would be best at ~0.5–5 GHz because the upper limit at 1.28 GHz implies deep upper limits at high frequencies in case of a steep spectrum, as shown in Fig. 4. Following the discussion from Sect. 3, the orbital phases at which the flux is higher are ~0.6−0.7, and at these phases the higher flux densities are received at ~0.5−2 GHz assuming a spectral index α = −1.0. In addition to this, below 0.5 GHz the pulse broadening due to the ISM scattering is very important for fast pulsars (see Appendix A for more details). Therefore, long (~ten hours) observations at ~0.5–5 GHz with Effelsberg, EVLA or more likely GBT directly pointing to LS I +61 303 around phases 0.6−0.7 are recommended to significantly improve these upper limits or have a good chance to detect the pulses. McSwain et al. (2011) performed a pulsar search in LS I +61 303 using GBT at a similar frequency range (bands C, S and X) and a different orbital phase (0.9), placing deep upper limits (4.1–14.5 μJy).
In this argumentation we are not considering the possibility of the pulsar beam not pointing close to our line of sight. This issue is less problematic at X-rays, because the beam is usually wider than the radio one. However, no X-ray pulsations have been detected so far from LS I +61 303. A deep search performed with Chandra observations provided 3σ upper limits on the pulsed fraction of the total X-ray emission ranging between 7 and 15% in the 0.3 − 10 keV energy band (Rea et al. 2010). It should be mentioned that the TeV binary system hosting PSR B1259–63 does not show X-ray pulsations during its periastron passage (Chernyakova et al. 2006), with an upper limit of 15% on the pulsed fraction (Rea et al. 2010), yet it is known to be a pulsar beamed at Earth.
An alternative way to experimentally prove the presence of a pulsar in LS I +61 303 is finding HE pulsations. As mentioned in Sect. 1, the HE emission detected by Fermi/LAT could be explained by inverse Compton scattering of photon fields in a striped pulsar wind model, which predicts pulsed and variable HE emission (Pétri & Dubus 2011).
A better orbital solution would improve the opacity estimation and the knowledge of the acceleration suffered by the putative pulsar and therefore the chances of resolving the pulses in observations along a large part of the orbit. In any case, because of the opacity of the binary system and the possibility of the putative pulsar not beaming towards Earth, it might be impossible to detect pulses even with infinite sensitivity.
Acknowledgments
We thank the staff of the GMRT who have made these observations possible. GMRT is run by the National Centre for Radio Astrophysiscs (NCRA) of the Tata Institute of Fundamental Research (TIFR). A.C., J.M.P., J.M., V.Z. and M.R. acknowledge support by the Spanish Ministerio de Ciencia e Innovación (MICINN) under grants AYA2010-21782-C03-01 and FPA2010-22056-C06-02. A.C. acknowledges support by Comissionat per a Universitats i Recerca of the DIUE of Generalitat de Catalunya and European Social Funds through grant 2010F I_B 00291. J.M.P. acknowledges financial support from ICREA Academia. J. Moldón acknowledges support by MICINN under grant BES-2008-004564. V.Z. was supported by the Spanish MEC through FPU grant AP2006-00077. J. Martí acknowledges support by grant AYA2010-21782-C03-03 from the MICINN, research group FQM-322 and excellence grant FQM-5418 from the Consejería de Innovación, Ciencia y Empresa (CICE) of Junta de Andalucía and FEDER funds. M.R. acknowledges financial support from MICINN and European Social Funds through a Ramón y Cajal fellowship.
References
- Abdo, A. A., Ackermann, M., Ajello, M., et al. 2009a, ApJ, 701, L123 [NASA ADS] [CrossRef] [Google Scholar]
- Abdo, A. A., Ackermann, M., Ajello, M., et al. 2009b, ApJ, 706, L56 [NASA ADS] [CrossRef] [Google Scholar]
- Acciari, V. A., Aliu, E., Arlen, T., et al. 2009a, ApJ, 700, 1034 [NASA ADS] [CrossRef] [Google Scholar]
- Acciari, V. A., Aliu, E., Arlen, T., et al. 2009b, ApJ, 698, L94 [NASA ADS] [CrossRef] [Google Scholar]
- Aharonian, F., Akhperjanian, A. G., Aye, K.-M., et al. 2005, A&A, 442, 1 [Google Scholar]
- Aharonian, F., Akhperjanian, A. G., Bazer-Bachi, A. R., et al. 2006, A&A, 460, 743 [NASA ADS] [CrossRef] [EDP Sciences] [Google Scholar]
- Aharonian, F. A., Akhperjanian, A. G., Bazer-Bachi, A. R., et al. 2007, A&A, 469, L1 [NASA ADS] [CrossRef] [EDP Sciences] [Google Scholar]
- Aharonian, F., Akhperjanian, A. G., Anton, G., et al. 2009, A&A, 507, 389 [Google Scholar]
- Albert, J., Aliu, E., Anderhub, H., et al. 2006, Science, 312, 1771 [NASA ADS] [CrossRef] [PubMed] [Google Scholar]
- Albert, J., Aliu, E., Anderhub, H., et al. 2009, ApJ, 693, 303 [NASA ADS] [CrossRef] [Google Scholar]
- Anderhub, H., Antonelli, L. A., Antoranz, P., et al. 2009, ApJ, 706, L27 [NASA ADS] [CrossRef] [Google Scholar]
- Aragona, C., McSwain, M. V., Grundstrom, E. D., et al. 2009, ApJ, 698, 514 [NASA ADS] [CrossRef] [Google Scholar]
- Bongiorno, S., Falcone, A., Stroh, M., et al. 2011, ApJ, 737, L11 [NASA ADS] [CrossRef] [Google Scholar]
- Casares, J., Ribas, I., Paredes, J. M., Martí, J., & Allen de Prieto, C. 2005a, MNRAS, 360, 1105 [NASA ADS] [CrossRef] [Google Scholar]
- Casares, J., Ribó, M., Ribas, I., et al. 2005b, MNRAS, 364, 899 [NASA ADS] [CrossRef] [Google Scholar]
- Chernyakova, M., Neronov, A., Lutovinov, A., Rodriguez, J., & Johnston, S. 2006, MNRAS, 367, 1201 [NASA ADS] [CrossRef] [Google Scholar]
- Clifton, T. R., & Lyne, A. G. 1986, Nature, 320, 43 [NASA ADS] [CrossRef] [Google Scholar]
- Coe, M. J., Bowring, S. R., Hall, C. J., & Stephen, J. B. 1982, Astrophys. Lett., 23, 17 [NASA ADS] [Google Scholar]
- Connors, T. W., Johnston, S., Manchester, R. N., & McConnell, D. 2002, MNRAS, 336, 1201 [NASA ADS] [CrossRef] [Google Scholar]
- Cordes, J. M., & Lazio, T. J. W. 2002 [arXiv:astro-ph/0207156v3] [Google Scholar]
- Cordes, J. M., & Rickett, B. J. 1998, ApJ, 507, 846 [NASA ADS] [CrossRef] [Google Scholar]
- Dhawan, V., Mioduszewski, A., & Rupen, M. 2006, in VI Microquasar Workshop: Microquasars and Beyond [Google Scholar]
- Dougherty, S. M., Pittard, J. M., Kasian, L., et al. 2003, A&A, 409, 217 [NASA ADS] [CrossRef] [EDP Sciences] [Google Scholar]
- Dubus, G. 2006, A&A, 456, 801 [NASA ADS] [CrossRef] [EDP Sciences] [Google Scholar]
- Dubus, G., & Giebels, B. 2008, The Astronomer’s Telegram, 1715, 1 [NASA ADS] [Google Scholar]
- Frail, D. A., & Hjellming, R. M. 1991, AJ, 101, 2126 [NASA ADS] [CrossRef] [Google Scholar]
- Gregory, P. C. 2002, ApJ, 575, 427 [NASA ADS] [CrossRef] [Google Scholar]
- Harrison, F. A., Ray, P. S., Leahy, D. A., Waltman, E. B., & Pooley, G. G. 2000, ApJ, 528, 454 [NASA ADS] [CrossRef] [Google Scholar]
- Hermsen, W., & Kuiper, L. 2006, in The keV to TeV connection, Rome, Italy, 17–19 October [Google Scholar]
- Hessels, J. W. T., Ransom, S. M., Kaspi, V. M., et al. 2008, in 40 Years of Pulsars: Millisecond Pulsars, Magnetars and More, eds. C. Bassa, Z. Wang, A. Cumming, & V. M. Kaspi, AIP Conf. Ser., 983, 613 [Google Scholar]
- Hinton, J. A., Skilton, J. L., Funk, S., et al. 2009, ApJ, 690, L101 [NASA ADS] [CrossRef] [Google Scholar]
- Hornby, J. M., & Williams, P. J. S. 1966, MNRAS, 131, 237 [NASA ADS] [CrossRef] [Google Scholar]
- Howarth, I. D., & Prinja, R. K. 1989, ApJS, 69, 527 [NASA ADS] [CrossRef] [Google Scholar]
- Hutchings, J. B. 1979, PASP, 91, 657 [NASA ADS] [CrossRef] [Google Scholar]
- Hutchings, J. B., & Crampton, D. 1981, PASP, 93, 486 [NASA ADS] [CrossRef] [Google Scholar]
- Johnston, S., Manchester, R. N., Lyne, A. G., et al. 1992, ApJ, 387, L37 [Google Scholar]
- Johnston, S., Manchester, R. N., Lyne, A. G., Nicastro, L., & Spyromilio, J. 1994, MNRAS, 268, 430 [NASA ADS] [Google Scholar]
- Johnston, S., Ball, L., Wang, N., & Manchester, R. N. 2005, MNRAS, 358, 1069 [NASA ADS] [CrossRef] [Google Scholar]
- Joshi, B. C., McLaughlin, M. A., Lyne, A. G., et al. 2009, MNRAS, 398, 943 [NASA ADS] [CrossRef] [Google Scholar]
- Klein, B., Kramer, M., Müller, P., & Wielebinski, R. 2004, in Young Neutron Stars and Their Environments, eds. F. Camilo, & B. M. Gaensler, IAU Symp., 218, 133 [Google Scholar]
- Kniffen, D. A., Alberts, W. C. K., Bertsch, D. L., et al. 1997, ApJ, 486, 126 [NASA ADS] [CrossRef] [Google Scholar]
- Lambert, H. C., & Rickett, B. J. 1999, ApJ, 517, 299 [NASA ADS] [CrossRef] [Google Scholar]
- Manchester, R. N., Hobbs, G. B., Teoh, A., & Hobbs, M. 2005, AJ, 129, 1993 [NASA ADS] [CrossRef] [Google Scholar]
- Maraschi, L., & Treves, A. 1981, MNRAS, 194, 1 [Google Scholar]
- Mariotti, M. 2011, The Astronomer’s Telegram, 3161, 1 [NASA ADS] [Google Scholar]
- Massi, M., Ribó, M., Paredes, J. M., et al. 2004, A&A, 414, L1 [NASA ADS] [CrossRef] [EDP Sciences] [Google Scholar]
- McSwain, M. V., Ray, P. S., Ransom, S. M., et al. 2011, ApJ, 738, 105 [NASA ADS] [CrossRef] [Google Scholar]
- Mendelson, H., & Mazeh, T. 1994, MNRAS, 267, 1 [NASA ADS] [Google Scholar]
- Moldón, J., Johnston, S., Ribó, M., Paredes, J. M., & Deller, A. T. 2011a, ApJ, 732, L10 [NASA ADS] [CrossRef] [Google Scholar]
- Moldón, J., Ribó, M., & Paredes, J. M. 2011b, The Astronomer’s Telegram, 3180, 1 [NASA ADS] [Google Scholar]
- Negueruela, I., Ribó, M., Herrero, A., et al. 2011, ApJ, 732, L11 [NASA ADS] [CrossRef] [Google Scholar]
- Ong, R. A. 2011, The Astronomer’s Telegram, 3153, 1 [NASA ADS] [Google Scholar]
- Paredes, J. M., Marziani, P., Martí, J., et al. 1994, A&A, 288, 519 [NASA ADS] [Google Scholar]
- Paredes, J. M., Martí, J., Peracaula, M., & Ribó, M. 1997, A&A, 320, L25 [NASA ADS] [Google Scholar]
- Paredes, J. M., Martí, J., Ribó, M., & Massi, M. 2000, Science, 288, 2340 [NASA ADS] [CrossRef] [PubMed] [Google Scholar]
- Peracaula, M., Martí, J., & Paredes, J. M. 1997, A&A, 328, 283 [NASA ADS] [Google Scholar]
- Pétri, J., & Dubus, G. 2011, MNRAS, 1193 [Google Scholar]
- Puls, J., Kudritzki, R.-P., Herrero, A., et al. 1996, A&A, 305, 171 [NASA ADS] [Google Scholar]
- Rea, N., & Torres, D. F. 2011, ApJ, 737, L12 [NASA ADS] [CrossRef] [Google Scholar]
- Rea, N., Torres, D. F., van der Klis, M., et al. 2010, MNRAS, 405, 2206 [NASA ADS] [Google Scholar]
- Rea, N., Torres, D. F., Caliandro, G. A., et al. 2011, MNRAS, 416, 1514 [NASA ADS] [CrossRef] [Google Scholar]
- Ribó, M., Paredes, J. M., Moldón, J., Martí, J., & Massi, M. 2008, A&A, 481, 17 [NASA ADS] [CrossRef] [EDP Sciences] [Google Scholar]
- Stokes, G. H., Taylor, J. H., Welsberg, J. M., & Dewey, R. J. 1985, Nature, 317, 787 [NASA ADS] [CrossRef] [Google Scholar]
- Takahashi, T., Kishishita, T., Uchiyama, Y., et al. 2009, ApJ, 697, 592 [NASA ADS] [CrossRef] [Google Scholar]
- Thompson, C., Blandford, R. D., Evans, C. R., & Phinney, E. S. 1994, ApJ, 422, 304 [Google Scholar]
- Torres, D. F., Zhang, S., Li, J., et al. 2010, ApJ, 719, L104 [NASA ADS] [CrossRef] [Google Scholar]
- White, R. L., & Chen, W. 1995, in Wolf-Rayet Stars: Binaries; Colliding Winds; Evolution, eds. K. A. van der Hucht, & P. M. Williams, IAU Symp., 163, 438 [Google Scholar]
- Zhang, S., Torres, D. F., Li, J., et al. 2010, MNRAS, 408, 642 [NASA ADS] [CrossRef] [Google Scholar]
Appendix A: Pulse width and broadening
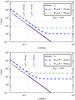 |
Fig. A.1 Pulse widths broadened due to ISM scattering in the frequency range at which the role of pulse broadening turns from crucial to negligible. The resulting width W10 is plotted considering P = 10 ms (blue dashed lines) and P = 50 ms (green dash-dotted lines) for intrinsic duty cycles Dint = 10% (top panel) and Dint = 50% (bottom panel). The pulse broadening timescale τd is plotted with a solid indigo line. Horizontal lines mark 75% of period, and vertical lines indicate the νc where the pulse widths cross this limit. |
The ISM electron density variations cause a multipath scattering reflected in a temporal broadening of the pulses at high DMs and low frequencies (see for instance Cordes & Rickett 1998; Cordes & Lazio 2002; Lambert & Rickett 1999). In our case we have corrected the duty cycle in Eqs. (3) and (4) using the following method. We have computed the flux density as a function of time, S(t), convolving an intrinsic pulse profile, Sint(t), and a broadening function b(t). Only with this purpose we considered an intrinsic Gaussian pulse profile with standard deviation σ,  (A.1)with a period of P = 10 ms, an intrinsic duty cycle of Dint = 10% and hence an intrinsic pulse width of Wint = 1 ms. In order to link σ and Wint in this context, we considered W = W10 (the pulse width at 10% of the peak). Therefore,
  .
.
The temporal pulse broadening is parametrised with the timescale τd, defined as the first moment of the broadening function, roughly a one-sided exponential, determined by deconvolving the intrinsic and measured pulse shapes (see for instance Cordes & Lazio 2002; Cordes & Rickett 1998). We effectively considered a one-sided exponential for the pulse broadening function b(t):  (A.2)Hence, τd is the width of the pulse to 1/e of the maximum pulse amplitude if the intrinsic pulse shape is a delta function. We have obtained the values of τd at several frequencies using the NE2001 electron density model (Cordes & Lazio 2002) in the direction of LS I +61 303 and considering a distance to the source of d = 2.0 ± 0.2 kpc.
Finally, the measured pulse profile S(t) is the convolution of Sint(t) and b(t):  (A.3)In Fig. A.1 we show the resulting pulse widths with P = 10 ms and 50 ms, and Dint = 10% (top panel) and 50% (bottom panel). Vertical lines indicate the frequencies νc at which D = 75% and thus the pulse is hardly detectable. For an intrinsic duty cycle of 10%, above ~ 0.5 GHz the effect is negligible. We conclude that the pulse broadening does not affect our observations at 1.28 GHz. In Fig. 4 this correction is used considering P = 10 ms to the points below 1 GHz. According to this result, at 120 MHz (the High Band of LOFAR) this presumed pulsar would not be detectable because the pulse width would be greater than the period. For this reason the LOFAR point is not corrected for pulse broadening. If the compact object in LS I +61 303 is a fast (P ~ 10 ms) pulsar, observations above 0.5 GHz are recommended to avoid the pulse broadening by the ISM.
All Tables
All Figures
|
Fig. 1 Expected LS I +61 303 pulsed flux density along the orbit at different frequencies for α = − 1.0 assuming that the intrinsic pulsed flux density at 1.3 GHz is S0 and considering free-free absorption effects. Periastron and apastron are indicated by the vertical black lines at phases 0.23 and 0.73, respectively. The highest observable flux density is expected to occur at 0.6 GHz at orbital phase ~0.6−0.7, three days before apastron. The observation phase range of this work is indicated by the vertical green stripe centred at 0.54. |
| In the text | |
|
Fig. 2 Optical depth in logarithmic scale (colour bar) for different combinations of stellar parameters at orbital phase 0.54. The dependence with the system inclination, i, in the wide range 15–90° (Casares et al. 2005a) is very low at this orbital phase, although it is strong around periastron. The terminal wind velocity is plotted between 600 km s-1 (wind velocity at the equator in McSwain et al. 2011) and 2000 km s-1. The expected stellar temperature ranges from 21 500 K McSwain et al. (2011) to 30 000 K. Casares et al. (2005a) estimated the stellar mass to be between 10 and 15 M⊙. The black circles mark the values adopted in this paper. |
| In the text | |
|
Fig. 3 Flux density upper limits in mJy in the direction of LS I +61 303 obtained with Eq. (4) for increasing values of the duty cycle and for different values of the correction factor K for the PA data. |
| In the text | |
|
Fig. 4 Upper limit of 0.38 mJy extended to the radio wavelengths considering α = − 0.5 (black lines), α = − 1.0 (green lines) and α = − 2.0 (blue lines). Dashed lines do not consider any absorption, while solid lines are affected by free-free absorption using Eqs. (1) and (2) and considering the orbital position at which the absorption is lowest (phase 0.61). Note that no intrinsic low-frequency cutoff has been introduced. Ten-hour potential sensitivities are plotted for the LOFAR (pentagon), GBT (triangles), Effelsberg (stars), EVLA (circles) and ALMA (diamonds) observatories. For the two latter, empty symbols are plotted using a reduced bandwidth of Δν = 800 MHz. |
| In the text | |
|
Fig. A.1 Pulse widths broadened due to ISM scattering in the frequency range at which the role of pulse broadening turns from crucial to negligible. The resulting width W10 is plotted considering P = 10 ms (blue dashed lines) and P = 50 ms (green dash-dotted lines) for intrinsic duty cycles Dint = 10% (top panel) and Dint = 50% (bottom panel). The pulse broadening timescale τd is plotted with a solid indigo line. Horizontal lines mark 75% of period, and vertical lines indicate the νc where the pulse widths cross this limit. |
| In the text | |
Current usage metrics show cumulative count of Article Views (full-text article views including HTML views, PDF and ePub downloads, according to the available data) and Abstracts Views on Vision4Press platform.
Data correspond to usage on the plateform after 2015. The current usage metrics is available 48-96 hours after online publication and is updated daily on week days.
Initial download of the metrics may take a while.