Free Access
Fig. 6
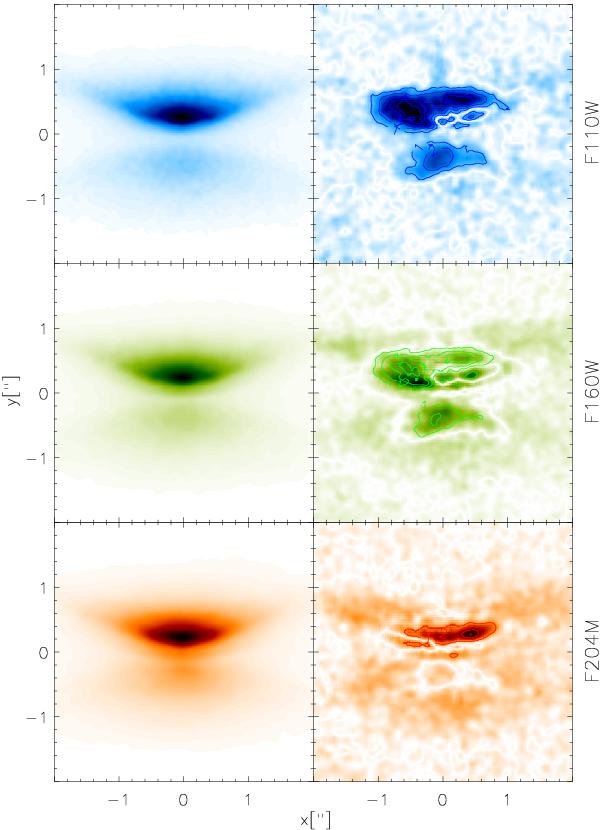
Simulated images of model A in the NIR and the deviations from observations with NICMOS with overlayed contour lines spaced at 1σ. As expected, the differences are lowest in the optimized F204M image and increase toward shorter wavelengths.
Current usage metrics show cumulative count of Article Views (full-text article views including HTML views, PDF and ePub downloads, according to the available data) and Abstracts Views on Vision4Press platform.
Data correspond to usage on the plateform after 2015. The current usage metrics is available 48-96 hours after online publication and is updated daily on week days.
Initial download of the metrics may take a while.