Free Access
Fig. 5
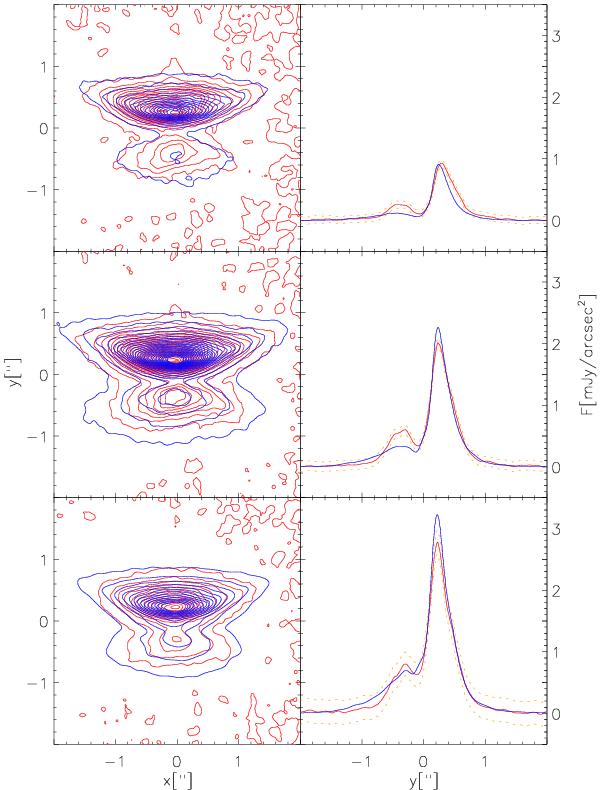
Contour plots and vertical cuts along the symmetry axis of the HST/NICMOS observations (red) and the best-fit model A (blue). The contours in the left column and the dotted intervals in the right column correspond to 1σ.
Current usage metrics show cumulative count of Article Views (full-text article views including HTML views, PDF and ePub downloads, according to the available data) and Abstracts Views on Vision4Press platform.
Data correspond to usage on the plateform after 2015. The current usage metrics is available 48-96 hours after online publication and is updated daily on week days.
Initial download of the metrics may take a while.