Fig. C.4
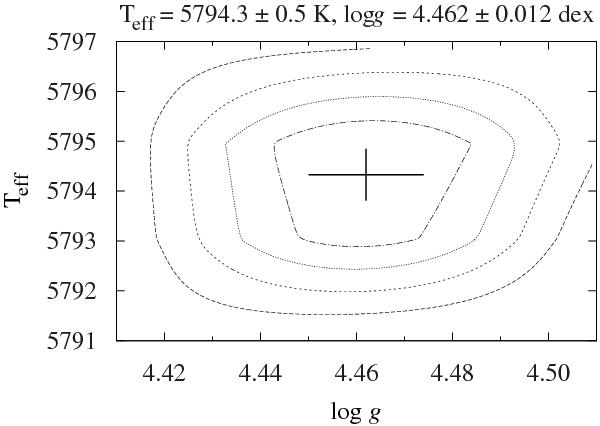
Contour plot of the parameter TG (Eq. (C.1)), which evaluates how good the differential spectroscopic equilibrium is. The minimum is shown by a cross at Teff = 5794.3 ± 0.5 K and log g = 4.462 ± 0.012 dex, which is in excellent agreement with our adopted solution. The contour levels increase in steps of ΔTG = 0.1 from the minimum.
Current usage metrics show cumulative count of Article Views (full-text article views including HTML views, PDF and ePub downloads, according to the available data) and Abstracts Views on Vision4Press platform.
Data correspond to usage on the plateform after 2015. The current usage metrics is available 48-96 hours after online publication and is updated daily on week days.
Initial download of the metrics may take a while.