Fig. C.3
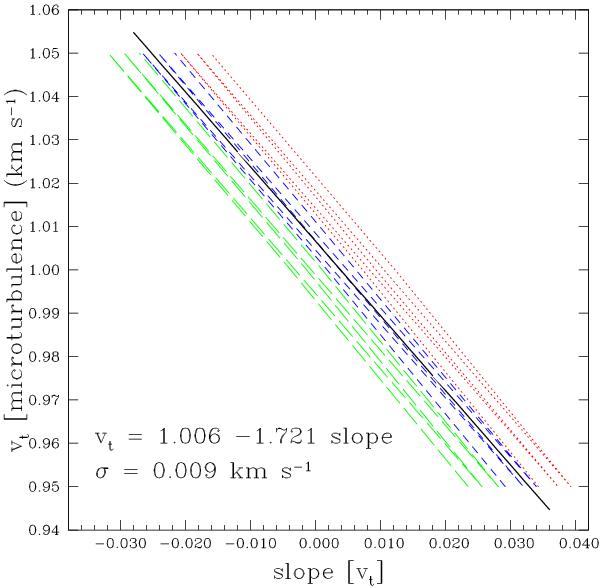
Microturbulence velocity vs. slope  (see Eq. (4)). The dotted, dashed and long dashed lines are for Teff = 5791, 5794, 5797 K, respectively, and the spread shown for each line style is due to a range in log g (4.40 dex ≤ log g ≤ 4.52 dex). This spread in Teff and log g corresponds to a scatter of 0.009 km s-1 in vt. The solid line represents a linear fit.
Current usage metrics show cumulative count of Article Views (full-text article views including HTML views, PDF and ePub downloads, according to the available data) and Abstracts Views on Vision4Press platform.
Data correspond to usage on the plateform after 2015. The current usage metrics is available 48-96 hours after online publication and is updated daily on week days.
Initial download of the metrics may take a while.