Fig. 2
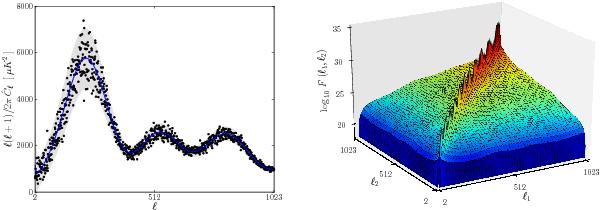
Left panel: the result of an exact maximum likelihood power spectrum estimation (filled circles) shows that the input power spectrum can be consistently recovered (solid line). The gray area indicates the 2-σ confidence region as derived from the Fisher matrix. Right panel: the Fisher matrix of the CMB power spectrum coefficients cannot be approximated well by a diagonal matrix.
Current usage metrics show cumulative count of Article Views (full-text article views including HTML views, PDF and ePub downloads, according to the available data) and Abstracts Views on Vision4Press platform.
Data correspond to usage on the plateform after 2015. The current usage metrics is available 48-96 hours after online publication and is updated daily on week days.
Initial download of the metrics may take a while.