Free Access
Fig. 11
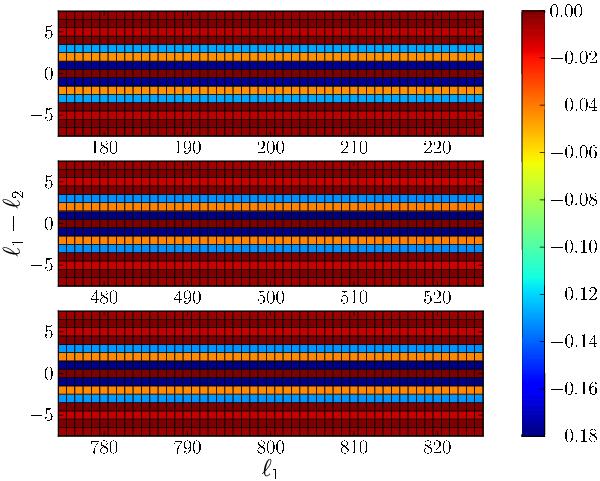
A small sky coverage induces complicated correlations. We plot the normalized correlation matrix for a simulation covering fsky = 40% of the sky. A larger mask increases the correlation in strength and range (cf. Fig. 3).
Current usage metrics show cumulative count of Article Views (full-text article views including HTML views, PDF and ePub downloads, according to the available data) and Abstracts Views on Vision4Press platform.
Data correspond to usage on the plateform after 2015. The current usage metrics is available 48-96 hours after online publication and is updated daily on week days.
Initial download of the metrics may take a while.