Fig. 3
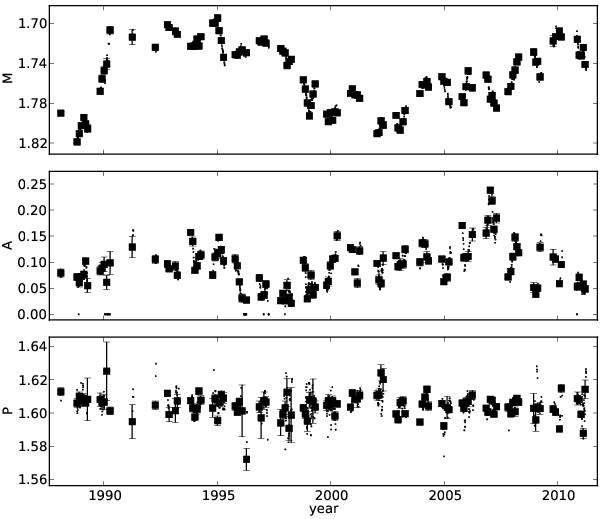
Long term variation of the mean differential magnitude M (top), total light curve amplitude A (middle) and photometric period P (bottom). M and A are given in magnitudes and P in days. Squares with error bars indicate parameter estimates from the independent datasets and dots parameter estimates from all other reliable datasets.
Current usage metrics show cumulative count of Article Views (full-text article views including HTML views, PDF and ePub downloads, according to the available data) and Abstracts Views on Vision4Press platform.
Data correspond to usage on the plateform after 2015. The current usage metrics is available 48-96 hours after online publication and is updated daily on week days.
Initial download of the metrics may take a while.