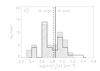
Fig. 9
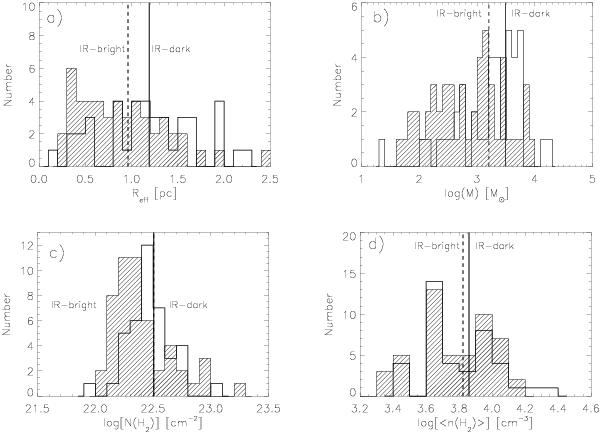
Distributions of a) clump effective radii, b) masses, c) H2 column densities, and d) H2 number densities. Open histograms represent the IR-dark clumps, while shaded histograms represent the IR-bright clumps (those with 8/24 μm emission). The solid and dashed vertical lines indicate the average values for IR-dark and IR-bright clumps, respectively. The average (median) radii for IR-dark and IR-bright clumps are 1.19 (1.14) and 0.96 (0.87) pc, respectively. The average (median) mass of IR-dark clumps is 3079 (2108) M⊙, whereas that of IR-bright clumps is 1604 (804) M⊙. The mean H2 column density is 3.2 × 1022 mm-2 for both distributions (median values are 2.8 × 10²² and 2.1 × 1022 cm-2 for IR-dark and IR-bright clumps, respectively). The average (median) H2 number densities for IR-dark and IR-bright clumps are 7250 (6000) cm-3 and 6667 (6000) mm-3, respectively.
Current usage metrics show cumulative count of Article Views (full-text article views including HTML views, PDF and ePub downloads, according to the available data) and Abstracts Views on Vision4Press platform.
Data correspond to usage on the plateform after 2015. The current usage metrics is available 48-96 hours after online publication and is updated daily on week days.
Initial download of the metrics may take a while.