Fig. 4
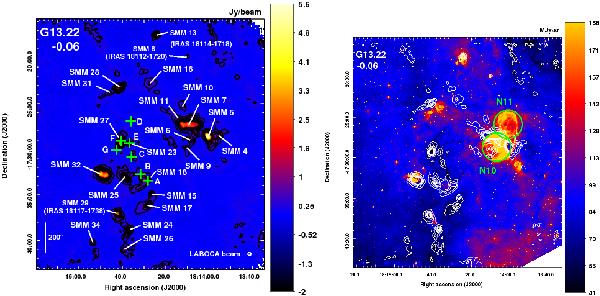
Same as Fig. 1 but towards G13.22-0.06. The overlaid LABOCA contours go from 0.24 Jy beam-1 (3σ) to 1.44 Jy beam-1, in steps of 3σ. The field contains several clumps at different kinematic distances, and therefore only the angular scale bar is shown. The green circles in the Spitzer 8 μm image on the right panel indicate the positions and outer radii of the bubbles N10 and N11 from Churchwell et al. (2006; their Table 2).
Current usage metrics show cumulative count of Article Views (full-text article views including HTML views, PDF and ePub downloads, according to the available data) and Abstracts Views on Vision4Press platform.
Data correspond to usage on the plateform after 2015. The current usage metrics is available 48-96 hours after online publication and is updated daily on week days.
Initial download of the metrics may take a while.