Fig. 3
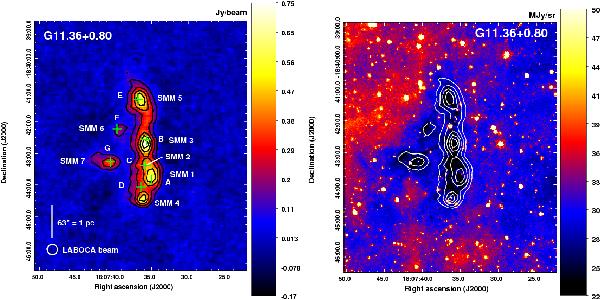
Same as Fig. 1 but towards G11.36+0.80. The obtained LABOCA map is zoomed-in towards the filamentary structure in the map centre because no submm dust emission was detected in other parts of the map. The overlaid LABOCA contours go from 0.12 Jy beam-1 (3σ) to 0.60 Jy beam-1, in steps of 3σ. Note that most of the line-observation target positions match the submm peak positions well. A scale bar indicating the 1 pc projected length is shown in the bottom left, with the assumption of a 3.27 kpc line-of-sight distance.
Current usage metrics show cumulative count of Article Views (full-text article views including HTML views, PDF and ePub downloads, according to the available data) and Abstracts Views on Vision4Press platform.
Data correspond to usage on the plateform after 2015. The current usage metrics is available 48-96 hours after online publication and is updated daily on week days.
Initial download of the metrics may take a while.