Fig. 14
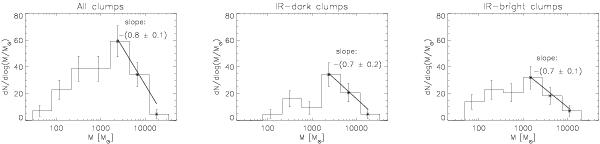
From left to right are shown the differential (dN/dlog M) clump mass distributions of the entire sample, IR-dark clumps, and IR-bright clumps. In all panels the mass bin size is Δlog (M/M⊙) ≃ 0.44. The error bars correspond to the standard Poisson  counting uncertainties. The solid lines indicate the best-fit power-law functions of the form dN/dlog M ∝ M−Γ, where the slope is given in each panel. The fits refer to masses above ~2400 M⊙ for both the entire sample and IR-dark clumps, and above ~1500 M⊙ for the IR-bright clumps. We note that the Salpeter IMF has a slope of Γ = 1.35.
Current usage metrics show cumulative count of Article Views (full-text article views including HTML views, PDF and ePub downloads, according to the available data) and Abstracts Views on Vision4Press platform.
Data correspond to usage on the plateform after 2015. The current usage metrics is available 48-96 hours after online publication and is updated daily on week days.
Initial download of the metrics may take a while.