Fig. 13
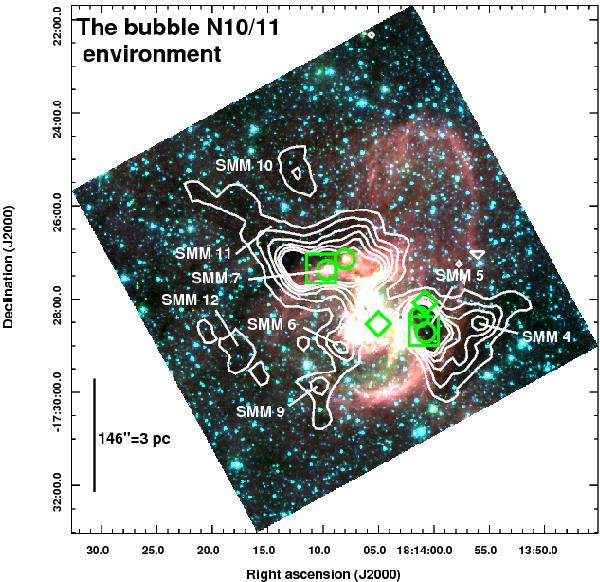
Spitzer-IRAC three-colour composite image towards the bubbles N10 and N11 overlaid with contours of LABOCA dust continuum emission. The 3.6, 4.5, and 8.0 μm emission is coded in blue, green, and red, respectively, and the colours are shown in linear scales. The contours are as in Fig. 4. The squares show the positions of the two 870-μm condensations found by Deharveng et al. (2010); their condensation 1 is associated with our clump SMM 5, and condensation 2 is associated with SMM 7. The circles show the positions of the candidate embedded MYSOs on the rims of N10 (Watson et al. 2008). The diamond symbols indicate the positions of the 6.7-GHz Class II methanol masers from Szymczak et al. (2002; right) and Pandian et al. (2008; left).
Current usage metrics show cumulative count of Article Views (full-text article views including HTML views, PDF and ePub downloads, according to the available data) and Abstracts Views on Vision4Press platform.
Data correspond to usage on the plateform after 2015. The current usage metrics is available 48-96 hours after online publication and is updated daily on week days.
Initial download of the metrics may take a while.