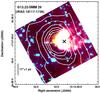
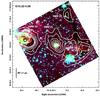
Fig. 12
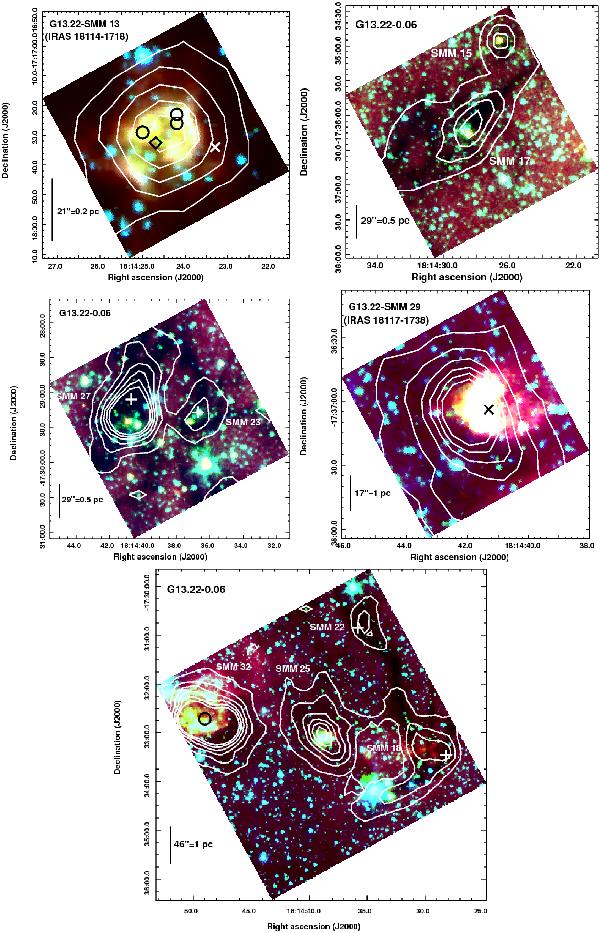
Spitzer-IRAC three-colour composite images towards EGO candidates in G13.22 overlaid with contours of LABOCA dust continuum emission. The 3.6, 4.5, and 8.0 μm emission is coded in blue, green, and red, respectively, and the colours are shown in linear scales. The contours are as in Fig. 4. Towards G13.22-SMM 13 (top left), the black circles indicate the positions of the 1.5-GHz VLA radio sources from Garwood et al. (1988), the diamond symbol shows the position of the 5-GHz VLA radio source from Becker et al. (1994), and the white cross shows the nominal catalogue position of IRAS 18114-1718. Towards G13.22-SMM 29 (middle right), the position of IRAS 18117-1738 is indicated by a black cross. The black circle towards G13.22-SMM 32 (bottom) denotes the 1.4-GHz radio source 181449-173243 from Condon et al. (1998). The white plus signs in the middle left and bottom panels represent the positions of our C17O observations. We note that in the bottom panel the linear scale bar corresponds to the line-of-sight distance of SMM 25.
Current usage metrics show cumulative count of Article Views (full-text article views including HTML views, PDF and ePub downloads, according to the available data) and Abstracts Views on Vision4Press platform.
Data correspond to usage on the plateform after 2015. The current usage metrics is available 48-96 hours after online publication and is updated daily on week days.
Initial download of the metrics may take a while.