Fig. 9
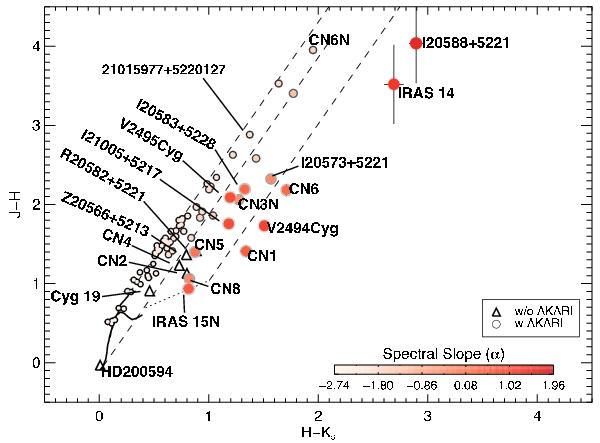
A near-infrared J − H vs. H − KS colour − colour diagram for sources in the studied field with high quality (q = 3) AKARI/IRC fluxes. Values are plotted in the 2MASS photometric system; the main sequence, dwarf and giant loci, as well as the CTTS loci (Meyer et al. 1997), are drawn along with reddening vectors. The colour bar and the size of the circles indicate the value of spectral slope (α) calculated over the K to 9 μm or K to 18 μm range of the SED (see Sect. 4.2 for an explanation).
Current usage metrics show cumulative count of Article Views (full-text article views including HTML views, PDF and ePub downloads, according to the available data) and Abstracts Views on Vision4Press platform.
Data correspond to usage on the plateform after 2015. The current usage metrics is available 48-96 hours after online publication and is updated daily on week days.
Initial download of the metrics may take a while.