Fig. 8
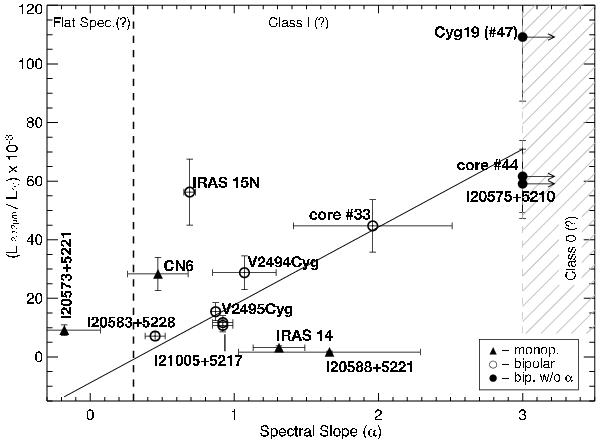
A plot showing the dependence of the near- to mid-infrared spectral slope (α) to the luminosity of the associated outflow derived from the H2 1−0 S(1) line flux. The vertical hatched area around α = 3 shows the upper tentative border for the Class I and 0 protostars according to Lada (1987); the vertical dashed line at α = 0.3 indicates the border between Class I and Flat Spectra type sources according to Greene et al. (1994). The error for the flux values was assumed to be of the order of 20%. The solid line represents the derived best-fit for the plotted data points of the form: y = (26.5 ± 2.9)x − (8.8 ± 4.6) with χ2 = 77.6.
Current usage metrics show cumulative count of Article Views (full-text article views including HTML views, PDF and ePub downloads, according to the available data) and Abstracts Views on Vision4Press platform.
Data correspond to usage on the plateform after 2015. The current usage metrics is available 48-96 hours after online publication and is updated daily on week days.
Initial download of the metrics may take a while.