Fig. 2
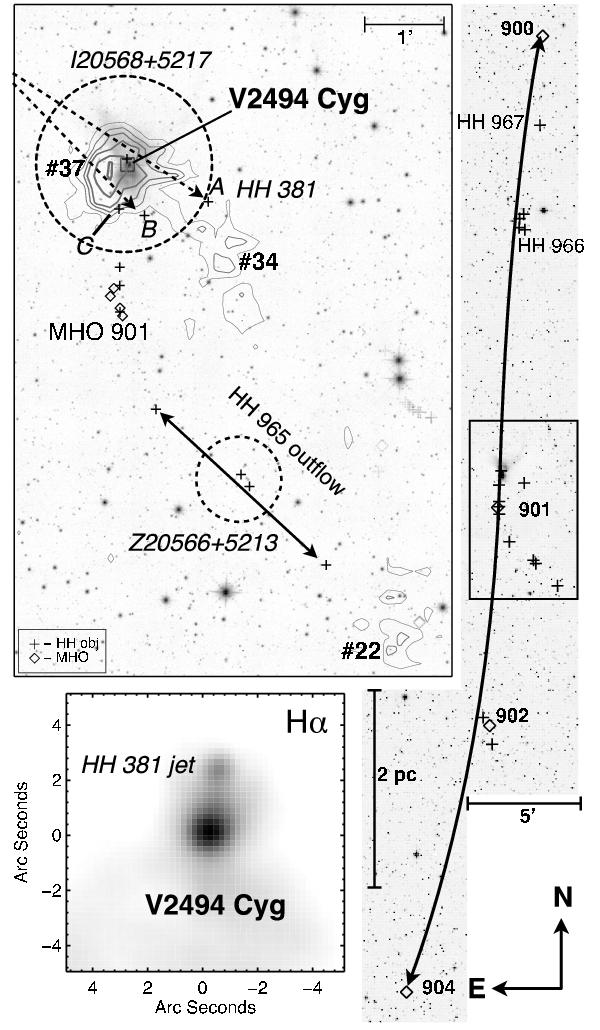
An H2 + continuum image of the V2494 Cyg outflow is presented in the right, wide-field panel. Here the diamonds and crosses indicate the positions of MHO and HH objects, respectively. The solid-line box marks the area around MHO 901 and the V2494Cyg nebula that is shown in more detail top-left. In this panel the grey-scale contours mark the CSO 1.1 mm data with values 40, 60, 80, 100, 140 and 180 mJy; the hashed numbers label the designated CSO cores from Aspin et al. (2011); the dashed-line circle shows the approximate extent of the IRAS HiRes 25 μm cores; the dashed-line and solid-line arrows show the suspected and confirmed outflows, respectively. The bottom-left panel shows a magnified view of V2494 Cyg in Hα (Magakian et al. 2010) in which the HH 381jet can be seen.
Current usage metrics show cumulative count of Article Views (full-text article views including HTML views, PDF and ePub downloads, according to the available data) and Abstracts Views on Vision4Press platform.
Data correspond to usage on the plateform after 2015. The current usage metrics is available 48-96 hours after online publication and is updated daily on week days.
Initial download of the metrics may take a while.