Fig. 11
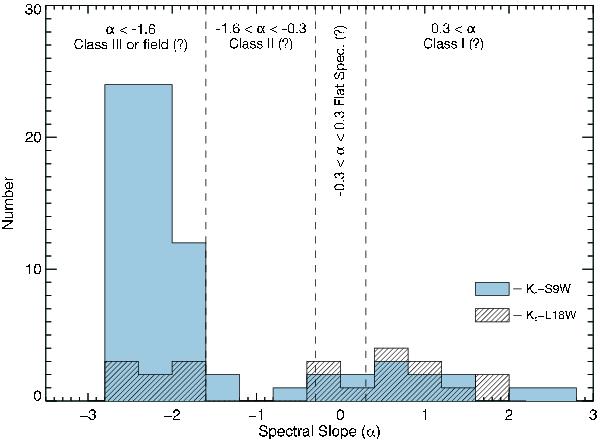
A histogram showing the distribution of spectral slope (α) for the sources with valid fluxes in the 2MASS and AKARI/IRC catalogues for the entire one-square-degree field. Slopes derived using K to 9 μm photometry and K to 18 μm data are plotted separately using filled and hatched histogram bars, respectively. Protostellar classifications are also indicated following Greene et al. (1994) and Evans et al. (2009).
Current usage metrics show cumulative count of Article Views (full-text article views including HTML views, PDF and ePub downloads, according to the available data) and Abstracts Views on Vision4Press platform.
Data correspond to usage on the plateform after 2015. The current usage metrics is available 48-96 hours after online publication and is updated daily on week days.
Initial download of the metrics may take a while.