Fig. 10
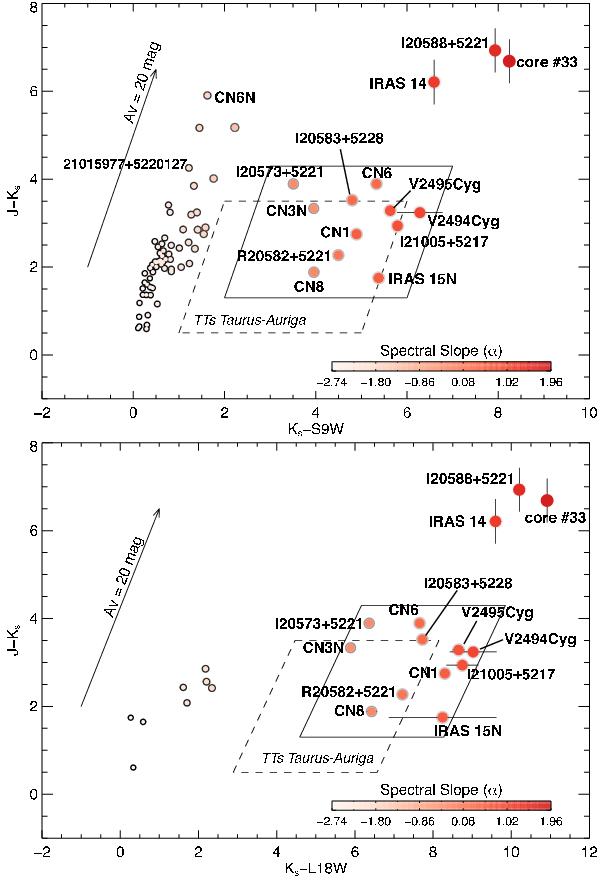
Near- to mid-infrared colour − colour diagrams for the same sources as plotted in Fig. 9. Top panel: a J − KS vs. KS-S9W colour − colour diagram (Takita et al. 2010) for all sources found in the one-square-degree field with valid near-IR fluxes in the 2MASS catalogue and 9 μm fluxes in the AKARI/IRC catalogue (Fig. 1). The arrow shows the interstellar extinction vector estimated from the Weingartner & Draine (2001) Milky Way model for RV = 3.1. Dashed-line and solid-line parallelograms show the distribution of CTTSs in the Taurus-Auriga region (Takita et al. 2010) and the distribution of driving sources in our region, respectively. Bottom panel: a J − KS vs. KS-L18W colour − colour diagram similar to the top panel, but for sources with valid JHKS fluxes in the 2MASS catalogue and 18 μm fluxes in the AKARI/IRC catalogue. Colour-bars and symbol sizes indicate the magnitude of the spectral slope (α).
Current usage metrics show cumulative count of Article Views (full-text article views including HTML views, PDF and ePub downloads, according to the available data) and Abstracts Views on Vision4Press platform.
Data correspond to usage on the plateform after 2015. The current usage metrics is available 48-96 hours after online publication and is updated daily on week days.
Initial download of the metrics may take a while.