Fig. 8
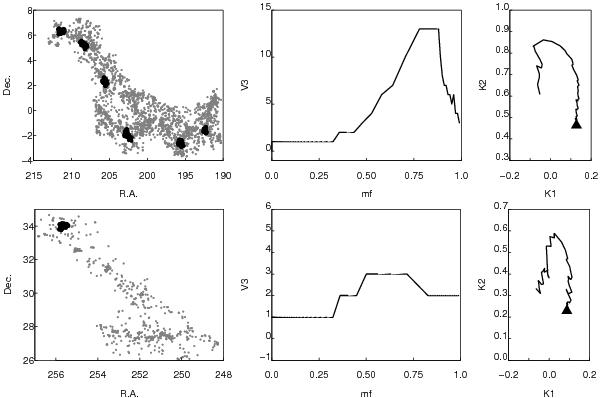
Sky distribution of galaxies (left panel), the fourth Minkowski functional V3 (middle panel) and the shapefinder’s K1-K2 plane (right panel) for two superclusters of filament morphology. Upper row – the supercluster SCl 027, lower row – the supercluster SCl 059. In the left panel black filled circles denote galaxies in clusters with at least 50 member galaxies, grey dots denote other galaxies. On the right panel triangle corresponds to K1 and K2 values at the mass fraction mf = 0 (the whole supercluster). Mass fraction increases anti-clockwise along the K1-K2 curve (the morphological signature).
Current usage metrics show cumulative count of Article Views (full-text article views including HTML views, PDF and ePub downloads, according to the available data) and Abstracts Views on Vision4Press platform.
Data correspond to usage on the plateform after 2015. The current usage metrics is available 48-96 hours after online publication and is updated daily on week days.
Initial download of the metrics may take a while.