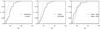
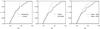
Fig. 4
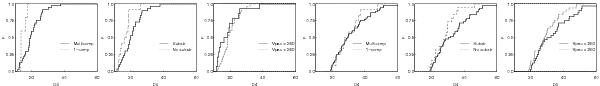
Cumulative distributions of the values of the environmental densities around clusters for the smoothing length 4 h-1 Mpc. Solid black line denote densities around multicomponent clusters (left panel), clusters with significant substructure (middle panel), and clusters with the peculiar velocities of their main galaxies larger than 250 km s-1 (right panel). Dashed grey line denote densities around one-component clusters (left panel), clusters without significant substructure (middle panel), and clusters with the peculiar velocities of their main galaxies smaller than 250 km s-1 (right panel). Upper row – distance interval 120 h-1 Mpc ≤ D ≤ 180 h-1 Mpc, lower row – distance interval 180 h-1 Mpc ≤ D ≤ 300 h-1 Mpc.
Current usage metrics show cumulative count of Article Views (full-text article views including HTML views, PDF and ePub downloads, according to the available data) and Abstracts Views on Vision4Press platform.
Data correspond to usage on the plateform after 2015. The current usage metrics is available 48-96 hours after online publication and is updated daily on week days.
Initial download of the metrics may take a while.