Fig. 3
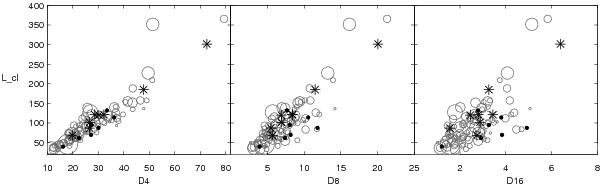
From left to right: cluster luminosities (in 1010 h-2 L⊙) vs. their environmental densities at the smoothing lengths 4, 8, and 16 h-1 Mpc (in units of mean density) (grey circles). The size of circles is proportional to the number of components found by 3D normal mixture modelling. Stars denote most multimodal clusters, and filled circles denote most unimodal clusters as described in the text.
Current usage metrics show cumulative count of Article Views (full-text article views including HTML views, PDF and ePub downloads, according to the available data) and Abstracts Views on Vision4Press platform.
Data correspond to usage on the plateform after 2015. The current usage metrics is available 48-96 hours after online publication and is updated daily on week days.
Initial download of the metrics may take a while.