Fig. 10
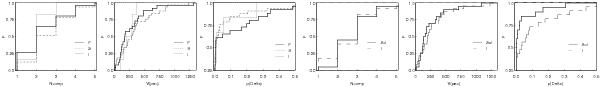
Cumulative distributions of the numbers of components in clusters, Ncomp, peculiar velocities of cluster main galaxies, Vpec (in km s-1), and p-value of the DS test, pΔ for clusters in superclusters of filament morphology (F, black solid line), of spider morphology (S, grey dashed line), and for isolated clusters (I, thin grey solid line) in the distance interval 180 h-1 Mpc ≤ D ≤ 300 h-1 Mpc (upper row), and for clusters in superclusters (Scl, black solid line) and for superclusters in low density regions (isolated clusters I, grey solid line) in the distance interval 120 h-1 Mpc ≤ D ≤ 180 h-1 Mpc (lower row).
Current usage metrics show cumulative count of Article Views (full-text article views including HTML views, PDF and ePub downloads, according to the available data) and Abstracts Views on Vision4Press platform.
Data correspond to usage on the plateform after 2015. The current usage metrics is available 48-96 hours after online publication and is updated daily on week days.
Initial download of the metrics may take a while.