Fig. 2
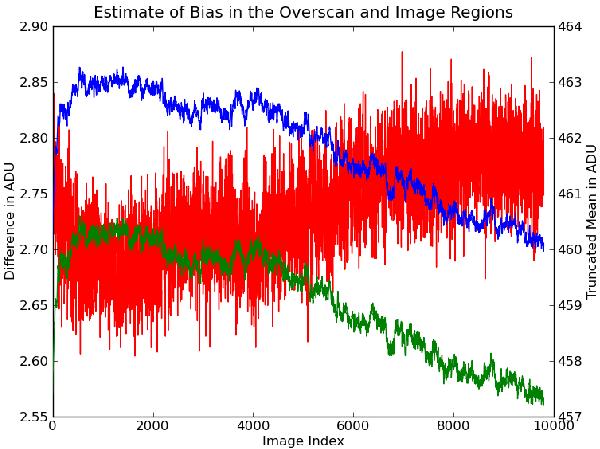
Plot of the truncated mean of a time series of 10 000 consecutive images. Blue is the truncated mean of the image area, and green is the truncated mean of the overscan region. Red is the difference between the two curves. An absolute variation in bias of about ± 3 ADU is seen over time (image index) for both the image area and the overscan region, whereas the variance of difference between them (red curve) is only about ± 0.05 ADU.
Current usage metrics show cumulative count of Article Views (full-text article views including HTML views, PDF and ePub downloads, according to the available data) and Abstracts Views on Vision4Press platform.
Data correspond to usage on the plateform after 2015. The current usage metrics is available 48-96 hours after online publication and is updated daily on week days.
Initial download of the metrics may take a while.