Fig. 1
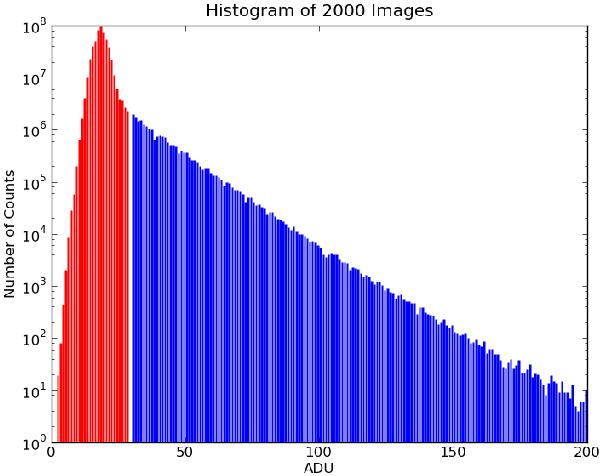
The histogram of 2000 dark images on a log scale. The exponential tail from the spurious charge can easily be seen. For this particular example the sum of the number of counts of the blue columns is approximately 4% of the sum of the red columns. The scale length of the tail is related to the electron multiplication gain, in accordance with Eq. (3).
Current usage metrics show cumulative count of Article Views (full-text article views including HTML views, PDF and ePub downloads, according to the available data) and Abstracts Views on Vision4Press platform.
Data correspond to usage on the plateform after 2015. The current usage metrics is available 48-96 hours after online publication and is updated daily on week days.
Initial download of the metrics may take a while.