Fig. 6
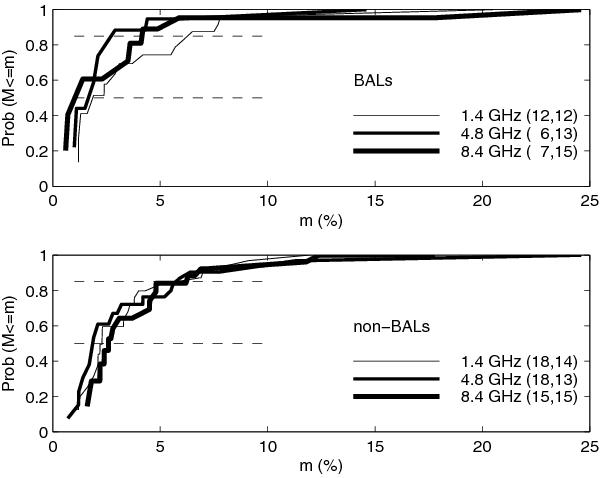
Cumulative distribution of the fractional polarisation for the two samples, at each of three frequencies. Each pair of numbers in parenthesis indicates the number of detections and the number of upper limits at that frequency. The dashed lines indicate the 50% percentile (i.e. the median) and the 85% percentile.
Current usage metrics show cumulative count of Article Views (full-text article views including HTML views, PDF and ePub downloads, according to the available data) and Abstracts Views on Vision4Press platform.
Data correspond to usage on the plateform after 2015. The current usage metrics is available 48-96 hours after online publication and is updated daily on week days.
Initial download of the metrics may take a while.