Fig. 4
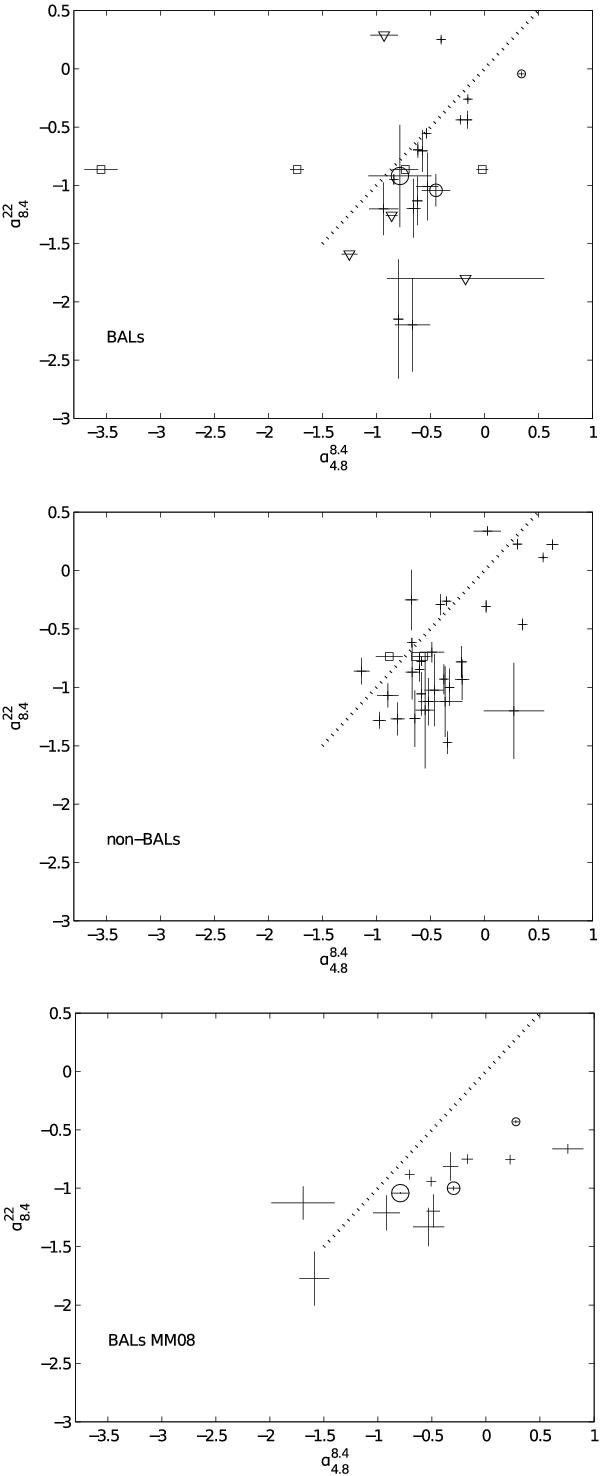
 versus
 for
the BAL QSOs, the non-BAL QSOs and MM08 sample. The dashed line traces the locus of
power-law spectra. Square symbols indicate sources lacking a 22-GHz flux density.
For these, we adopted the mean
value of the sample. Upper limits to are
plotted as triangles. Circles indicate objects in common with MM08 (symbol size
increases with the RA of the source).
for
the BAL QSOs, the non-BAL QSOs and MM08 sample. The dashed line traces the locus of
power-law spectra. Square symbols indicate sources lacking a 22-GHz flux density.
For these, we adopted the mean
value of the sample. Upper limits to are
plotted as triangles. Circles indicate objects in common with MM08 (symbol size
increases with the RA of the source).
Current usage metrics show cumulative count of Article Views (full-text article views including HTML views, PDF and ePub downloads, according to the available data) and Abstracts Views on Vision4Press platform.
Data correspond to usage on the plateform after 2015. The current usage metrics is available 48-96 hours after online publication and is updated daily on week days.
Initial download of the metrics may take a while.