Free Access
Fig. 2
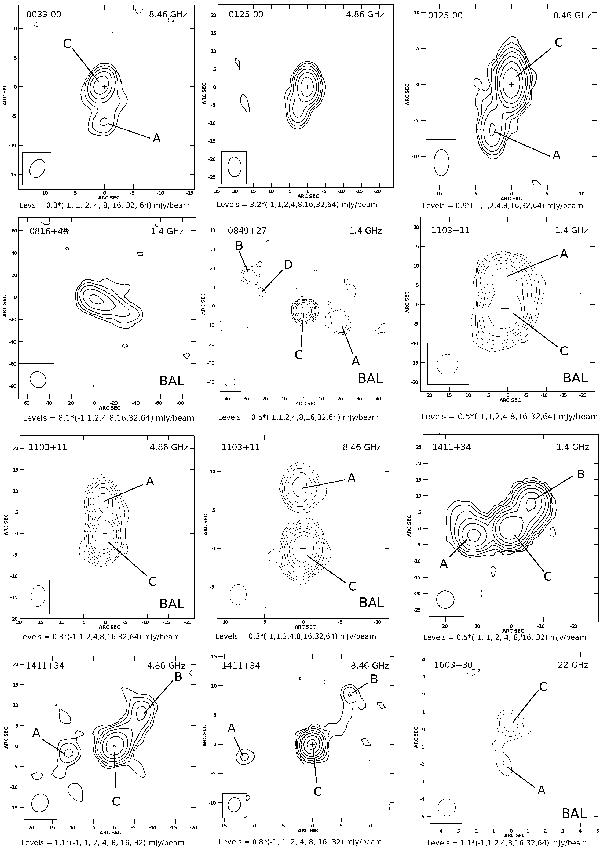
Maps of the resolved QSOs. The synthesised beam size is shown in the lower left corner of the map. Levels are multiples of the 3-σ flux density value in mJy/beam, according to the legend. A cross indicates the SDSS optical position.
Current usage metrics show cumulative count of Article Views (full-text article views including HTML views, PDF and ePub downloads, according to the available data) and Abstracts Views on Vision4Press platform.
Data correspond to usage on the plateform after 2015. The current usage metrics is available 48-96 hours after online publication and is updated daily on week days.
Initial download of the metrics may take a while.