Fig. 1
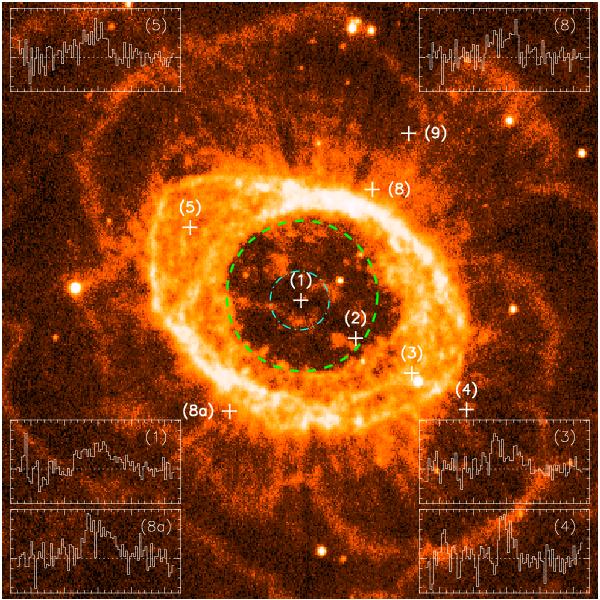
Spectra of the [CII]158 μm emission observed with GREAT towards NGC 6720 obtained at different offsets from the center (see Table 1), overlaid on a  H2 2.1 μm image (taken by David Thompson). The positions of the
  GREAT beam, shown in cyan at the center (J2000 RA = 18:53:35.08, Dec = 33:01:45.0) are marked by crosses. The small tick marks are separated by 10 km s-1 on the velocity axis (Vlsr), and by 0.1 K on the intensity axis (
 ). The spectrum at position #4 has been scaled by a factor 0.75. The equator of the multipolar model we propose for NGC 6720 is shown by the green dashed circle with diameter 40′′.
Current usage metrics show cumulative count of Article Views (full-text article views including HTML views, PDF and ePub downloads, according to the available data) and Abstracts Views on Vision4Press platform.
Data correspond to usage on the plateform after 2015. The current usage metrics is available 48-96 hours after online publication and is updated daily on week days.
Initial download of the metrics may take a while.