Fig. 6
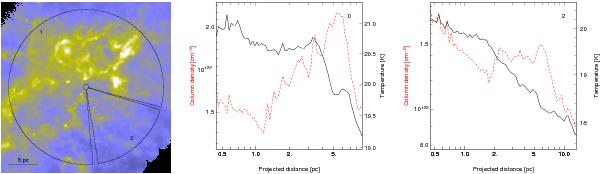
Left: column density map of NGC 6611 with radial segments as indicated. Segment 1 (middle) contains all of the star formation activity in the region, and segment 2 (right) the cavity carved out by the NGC 6611 cluster. These profiles have been averaged over azimuthal angle. The black solid line is the dust temperature profile, while the red dashed line is the column density profile. More detailed segments for each region inside segment 1 are given in Fig. C.1. Cuts are the median profile in each segment to limit biases introduced by the presence of protostars.
Current usage metrics show cumulative count of Article Views (full-text article views including HTML views, PDF and ePub downloads, according to the available data) and Abstracts Views on Vision4Press platform.
Data correspond to usage on the plateform after 2015. The current usage metrics is available 48-96 hours after online publication and is updated daily on week days.
Initial download of the metrics may take a while.