Fig. 9
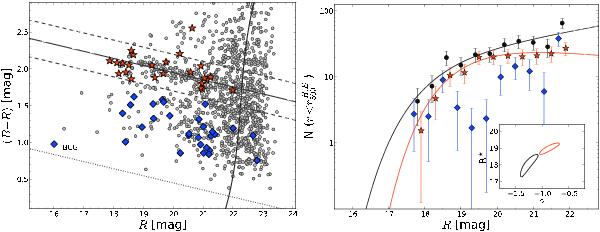
Left: colour–magnitude diagram with the corresponding red sequence
indicated by a solid line and its 3σ = 0.249 magnitude intervals by
dashed lines. The sample is complete down to the curve at ~22 mag, which varies
slightly with the B − R colour. We thus limited
the analysis to the galaxies brighter than R = 22 mag. The dotted
line denotes the colour cut that is 1.5 mag bluer than the red sequence, below which
the objects were considered as foreground contamination. Red stars and blue diamonds
indicate red and blue spectroscopic member galaxies regardless of their
clustercentric distances. The BCG is extremely blue with
B − R = 0.98. Right: cluster
galaxy luminosity functions for red (red stars), blue (blue diamonds), and all
(black circles) members within  derived from the X-ray hydrostatic mass estimate. The membership is statistically
determined using control fields with the background contamination statistically
subtracted. The best-fit Schechter (1976)
functions are shown in red and black curves for the red and all members,
respectively. The inset shows the 68% confidence region for the
R ⋆ and α
parameters of the best-fit Schechter (1976)
functions. No fit was possible for the blue members.
derived from the X-ray hydrostatic mass estimate. The membership is statistically
determined using control fields with the background contamination statistically
subtracted. The best-fit Schechter (1976)
functions are shown in red and black curves for the red and all members,
respectively. The inset shows the 68% confidence region for the
R ⋆ and α
parameters of the best-fit Schechter (1976)
functions. No fit was possible for the blue members.
Current usage metrics show cumulative count of Article Views (full-text article views including HTML views, PDF and ePub downloads, according to the available data) and Abstracts Views on Vision4Press platform.
Data correspond to usage on the plateform after 2015. The current usage metrics is available 48-96 hours after online publication and is updated daily on week days.
Initial download of the metrics may take a while.