Fig. 8
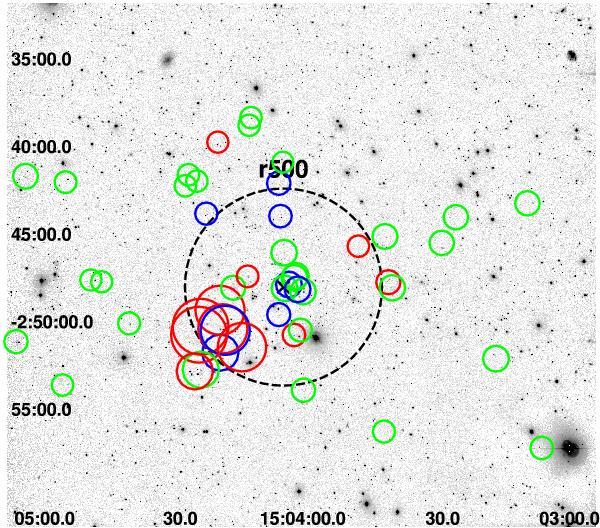
WFI B-band imaging. Overlaid circles in blue, red and green denote
cluster galaxies with spectroscopic follow-up data that have clustercentric
velocities toward the observer greater than 1000 km s-1, away from the
observer greater than 1000 km s-1, and smaller than
1000 km s-1, respectively. The radii of these circles are proportional
to  . The black cross
denotes the X-ray flux-weighted centroid and the black dashed circle
denotes
. The black cross
denotes the X-ray flux-weighted centroid and the black dashed circle
denotes  .
.
Current usage metrics show cumulative count of Article Views (full-text article views including HTML views, PDF and ePub downloads, according to the available data) and Abstracts Views on Vision4Press platform.
Data correspond to usage on the plateform after 2015. The current usage metrics is available 48-96 hours after online publication and is updated daily on week days.
Initial download of the metrics may take a while.