Fig. 7
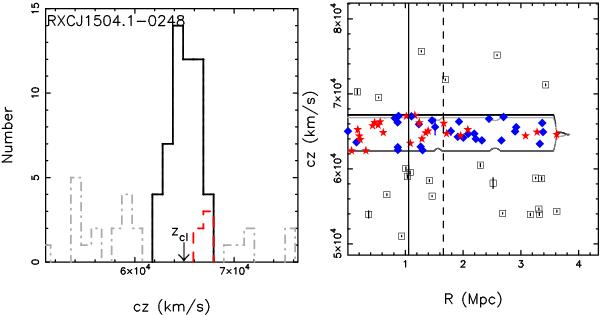
Left: histogram of the line-of-sight velocities. Member galaxies
of the cluster, member galaxies of the high velocity group, and non-member galaxies
are in solid (black), dashed (red), and dash-dotted (grey) lines. The arrow shows
the cluster redshift. Right: line-of-sight velocity versus
projected radius, in which filled blue diamonds and red stars show blue and red
member galaxies in the caustic (black curve), and open squares show fore- and
background galaxies. The grey curve shows the symmetric boundary by choosing the
minimum of the values on both sides of the caustic boundary relative to the cluster
redshift. The cluster radii,  and
and  ,
derived from the mass distribution using the caustic method are shown as solid and
dashed vertical lines, respectively.
,
derived from the mass distribution using the caustic method are shown as solid and
dashed vertical lines, respectively.
Current usage metrics show cumulative count of Article Views (full-text article views including HTML views, PDF and ePub downloads, according to the available data) and Abstracts Views on Vision4Press platform.
Data correspond to usage on the plateform after 2015. The current usage metrics is available 48-96 hours after online publication and is updated daily on week days.
Initial download of the metrics may take a while.