Fig. 5
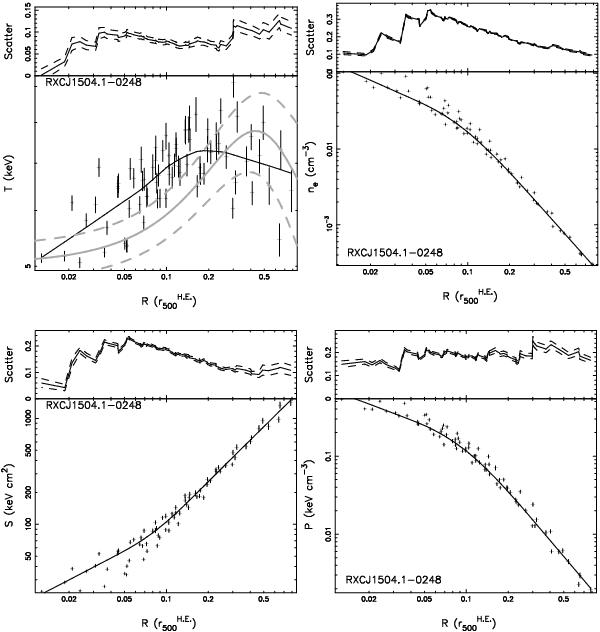
Temperature (upper left), electron number-density (upper right), entropy (lower left), and pressure (lower right) distributions of the spectrally measured 2D maps using the Sanders (2006) binning scheme are shown as crosses with their local regression fits in black curves. The solid and dashed grey curves in the upper left plot show the parametrization of the deprojected temperature profile and its 1-σ interval derived in Sect. 2.3. Differential scatter and its 1-σ intervals of the temperature, electron number-density, entropy, and pressure fluctuations in the 2D maps are shown in solid and dashed black curves in their upper panels.
Current usage metrics show cumulative count of Article Views (full-text article views including HTML views, PDF and ePub downloads, according to the available data) and Abstracts Views on Vision4Press platform.
Data correspond to usage on the plateform after 2015. The current usage metrics is available 48-96 hours after online publication and is updated daily on week days.
Initial download of the metrics may take a while.