Fig. 3
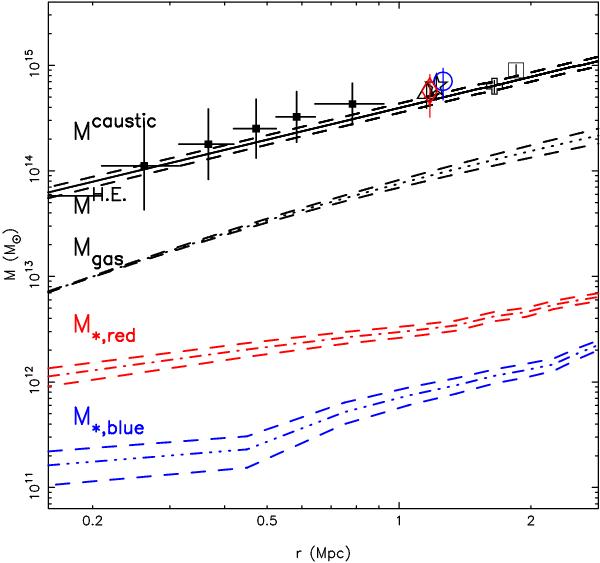
Cumulative mass distributions (1) using the X-ray hydrostatic method (filled
squares), (2) using the caustic method (black solid curve), (3) of the gas mass
estimate (black dotted curve), (4) of the stellar mass estimate of the red galaxies
(red dash-dotted curve), and (5) of the stellar mass estimate of the blue galaxies
(blue dash-dotted-dotted-dotted curve). The dashed curves and error bars denote
1σ intervals. The open star, triangle, diamond, and circle
indicate the dynamical mass estimates ( )
using 53, 48, 24 red, and 29 blue cluster members according to the Biviano et al.
(2006) method. The open square and cross
denote the richness-derived mass estimates (
)
using 53, 48, 24 red, and 29 blue cluster members according to the Biviano et al.
(2006) method. The open square and cross
denote the richness-derived mass estimates ( and
and  )
based on photometric data using the definitions of Johnston et al. (2007) and Hansen et al. (2009).
)
based on photometric data using the definitions of Johnston et al. (2007) and Hansen et al. (2009).
Current usage metrics show cumulative count of Article Views (full-text article views including HTML views, PDF and ePub downloads, according to the available data) and Abstracts Views on Vision4Press platform.
Data correspond to usage on the plateform after 2015. The current usage metrics is available 48-96 hours after online publication and is updated daily on week days.
Initial download of the metrics may take a while.