Fig. 2
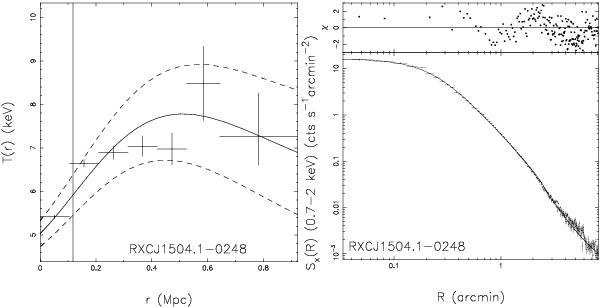
Left: deprojected temperature measurement versus radius with the
parametrized temperature distribution indicated by the solid curve and the
1σ interval by the dashed curves. The vertical line denotes
 .
Right: surface brightness versus projected distance from the
X-ray flux-weighted centroid with the parametrized surface brightness distribution
in solid curve. The upper panel shows deviations of the model from
the data points normalized by the 1σ errors.
.
Right: surface brightness versus projected distance from the
X-ray flux-weighted centroid with the parametrized surface brightness distribution
in solid curve. The upper panel shows deviations of the model from
the data points normalized by the 1σ errors.
Current usage metrics show cumulative count of Article Views (full-text article views including HTML views, PDF and ePub downloads, according to the available data) and Abstracts Views on Vision4Press platform.
Data correspond to usage on the plateform after 2015. The current usage metrics is available 48-96 hours after online publication and is updated daily on week days.
Initial download of the metrics may take a while.