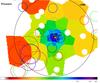
Fig. A.1
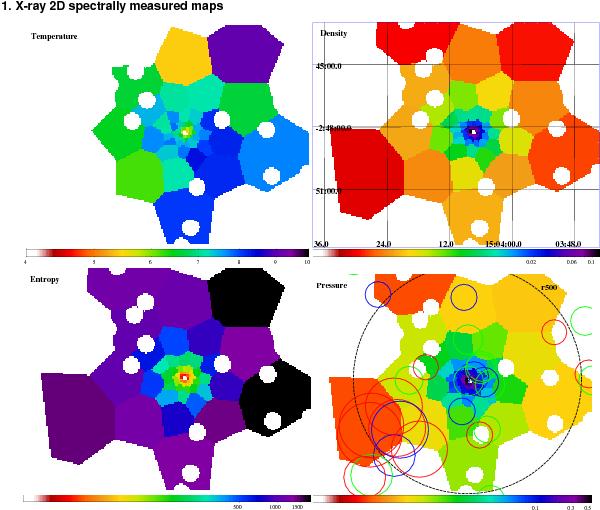
Two-dimensional X-ray spectrally measured temperature (upper left),
electron number-density (upper right), entropy (lower
left), and pressure (lower right) maps using the
Cappellari & Copin (2003) binning scheme. Overlaid circles in blue, red, and
green denote cluster galaxies that have spectroscopic follow-up data with their
clustercentric velocities toward the observer greater than 1000 km s-1,
away from the observer greater than 1000 km s-1, and smaller than
1000 km s-1, respectively. The radii of these circles are proportional to
 . The black cross
denotes the X-ray flux-weighted centroid and the black dashed circle denotes
. The black cross
denotes the X-ray flux-weighted centroid and the black dashed circle denotes
 .
The white holes mask X-ray detected point sources. The colour scales logarithmically
from 4 to 10 in keV for temperature, from 0.00005 to 0.12 in cm-3 for
electron number density, from 10 to 1800 in keV cm2 for entropy, and from
0.0001 to 0.54 in keV cm-3 for pressure.
.
The white holes mask X-ray detected point sources. The colour scales logarithmically
from 4 to 10 in keV for temperature, from 0.00005 to 0.12 in cm-3 for
electron number density, from 10 to 1800 in keV cm2 for entropy, and from
0.0001 to 0.54 in keV cm-3 for pressure.
Current usage metrics show cumulative count of Article Views (full-text article views including HTML views, PDF and ePub downloads, according to the available data) and Abstracts Views on Vision4Press platform.
Data correspond to usage on the plateform after 2015. The current usage metrics is available 48-96 hours after online publication and is updated daily on week days.
Initial download of the metrics may take a while.