Fig. 10
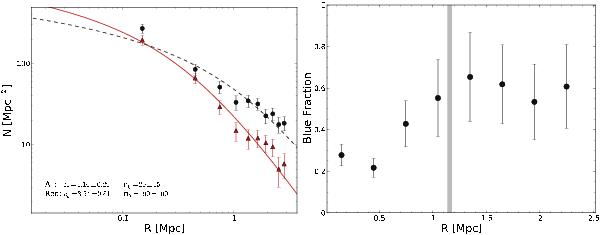
Left: number density profiles with their best-fit NFW models for
red member galaxies (red triangles, solid curve) and all members (black circles,
dashed curve), respectively. We obtained reduced
χ2 = 1.03,2.24 for the red and all
member galaxies, which indicates that the red galaxies follow well the theoretical
profile and the blue galaxies may account for the deviation of the fit for all
member galaxies. The bin size is 300 kpc. Right: ratio of blue to
all member galaxies as a function of projection distance from the X-ray
flux-weighted centroid. The vertical line
remarks  .
.
Current usage metrics show cumulative count of Article Views (full-text article views including HTML views, PDF and ePub downloads, according to the available data) and Abstracts Views on Vision4Press platform.
Data correspond to usage on the plateform after 2015. The current usage metrics is available 48-96 hours after online publication and is updated daily on week days.
Initial download of the metrics may take a while.