Fig. 4
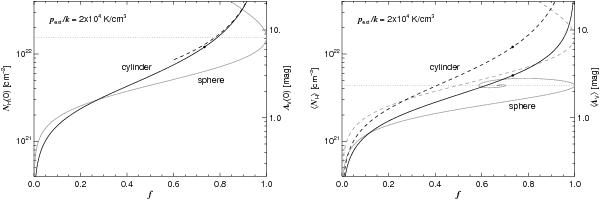
Like Fig. 1, but for the central column density (left panel) and mean column density (right panel) through an isothermal self-gravitating cylinder (black) and sphere (grey), as a function of mass fraction f. The dashed line in the left-hand plot is the approximation given in Eq. (19). The dashed lines in the right-hand plot echo the central column densities from the left-hand plot for comparison. The horizontal dotted lines give the values achieved by a critical stable sphere. The values for a cylinder with that overpressure, mass fraction 0.733, are shown as filled black circles.
Current usage metrics show cumulative count of Article Views (full-text article views including HTML views, PDF and ePub downloads, according to the available data) and Abstracts Views on Vision4Press platform.
Data correspond to usage on the plateform after 2015. The current usage metrics is available 48-96 hours after online publication and is updated daily on week days.
Initial download of the metrics may take a while.