Fig. 10
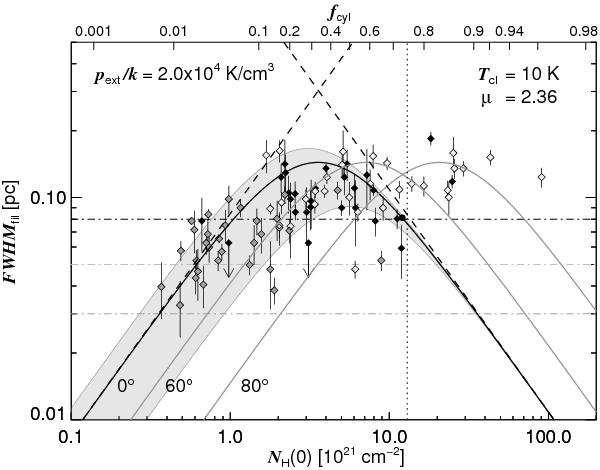
FWHM-NH(0) relation of filaments.
Observed values in Polaris (dark grey
symbols), IC 5146 (black symbols), and
Aquila (light grey symbols), from Fig. 7 of
Arzoumanian et al. (2011). Note that we are
plotting the column density of H nucleons rather than H2. We also lowered
their values by 2.33/2.8 to correct for the value of
 that they adopted. The horizontal dashed-dotted lines give the imaging resolution
achieved in the three fields (black: IC 5146,
dark grey: Polaris, light grey: Aquila). Predictions from the model of
pressure-confined isothermal self-gravitating cylinders are given for three different
inclination angles (0°, 60°, and 80°; solid black and
grey curves). The cloud temperature of the molecular gas is taken to be
T = 10 K. The external pressure provided by the ambient medium is
assumed to be
pext/k = 2 × 10⁴ K cm-3
(see discussion in Appendix A.3). The dashed
lines are the asymptotes for low and high overpressure
pc/pext
or fcyl (this is a logarithmic version of Fig. 8). For an overpressure corresponding to that of a
critical stable sphere, and for inclination 0°, the expected value is shown
as the filled black circle. Likewise, the vertical dotted line indicates the column
density of a cylinder with mass ratio fcyl = 0.75; the
upper non-linear scale indicates other values of fcyl for
this inclination. The expected range for a pressure regime 1.5 to
5 × 10⁴ K cm-3 is shown by light grey shading.
that they adopted. The horizontal dashed-dotted lines give the imaging resolution
achieved in the three fields (black: IC 5146,
dark grey: Polaris, light grey: Aquila). Predictions from the model of
pressure-confined isothermal self-gravitating cylinders are given for three different
inclination angles (0°, 60°, and 80°; solid black and
grey curves). The cloud temperature of the molecular gas is taken to be
T = 10 K. The external pressure provided by the ambient medium is
assumed to be
pext/k = 2 × 10⁴ K cm-3
(see discussion in Appendix A.3). The dashed
lines are the asymptotes for low and high overpressure
pc/pext
or fcyl (this is a logarithmic version of Fig. 8). For an overpressure corresponding to that of a
critical stable sphere, and for inclination 0°, the expected value is shown
as the filled black circle. Likewise, the vertical dotted line indicates the column
density of a cylinder with mass ratio fcyl = 0.75; the
upper non-linear scale indicates other values of fcyl for
this inclination. The expected range for a pressure regime 1.5 to
5 × 10⁴ K cm-3 is shown by light grey shading.
Current usage metrics show cumulative count of Article Views (full-text article views including HTML views, PDF and ePub downloads, according to the available data) and Abstracts Views on Vision4Press platform.
Data correspond to usage on the plateform after 2015. The current usage metrics is available 48-96 hours after online publication and is updated daily on week days.
Initial download of the metrics may take a while.