Fig. 3
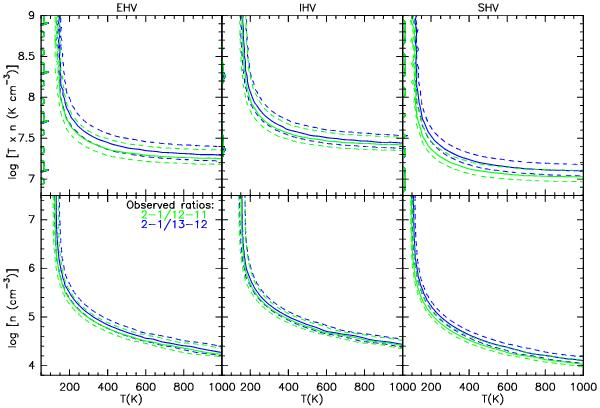
LVG results produced by the RADEX code for the observed intensity ratios in the EHV, IHV, and SHV ranges (left, middle, and right panels, respectively). The results are shown as T vs. n and n × T (thermal pressure) vs. T plots (lower and upper panels, respectively). The CO (2–1)/(12–11) ratio is indicated in green and the CO (2–1)/(13–12) ratio in blue. The observed ratio is drawn with solid lines, while the line ratio uncertainty (including statistical and 20% of the calibration errors) with dashed lines. N = 2 × 10¹⁷, 5 × 10¹⁷, and 7 × 1017 cm-3; and Δν = 40, 50, and 30 km s-1, for EHV, IHV, and SHV, respectively.
Current usage metrics show cumulative count of Article Views (full-text article views including HTML views, PDF and ePub downloads, according to the available data) and Abstracts Views on Vision4Press platform.
Data correspond to usage on the plateform after 2015. The current usage metrics is available 48-96 hours after online publication and is updated daily on week days.
Initial download of the metrics may take a while.