Fig. 1
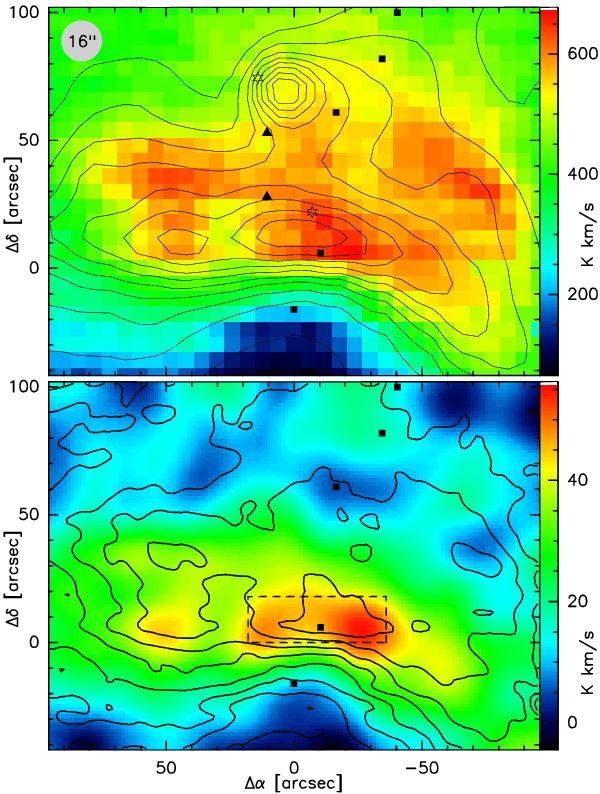
Top: integrated (5–15 km s-1) [Cii] intensity map of NGC 2024 (color code). Comparison data: MSX Band A (8.28 μm) (contours), 6 cm continuum peaks (triangles) (Crutcher et al. 1986), 1.3 mm continuum emission clumps FIR2 to FIR6 (squares) (Mezger et al. 1988), and embedded infrared point sources IRS2 (Grasdalen 1974) and IRS3 (Barnes et al. 1989) (stars). Bottom: overlay of the [13Cii] (color coded) and the [12Cii] integrated intensities (contours: 100 K km s-1 to 625 K km s-1 in steps of 75 K km s-1). The [13Cii] map has been smoothed to a resolution of 25″. The dashed box outlines the area of strong emission that was used in the analysis of Sect. 4.
Current usage metrics show cumulative count of Article Views (full-text article views including HTML views, PDF and ePub downloads, according to the available data) and Abstracts Views on Vision4Press platform.
Data correspond to usage on the plateform after 2015. The current usage metrics is available 48-96 hours after online publication and is updated daily on week days.
Initial download of the metrics may take a while.