Free Access
Fig. 2
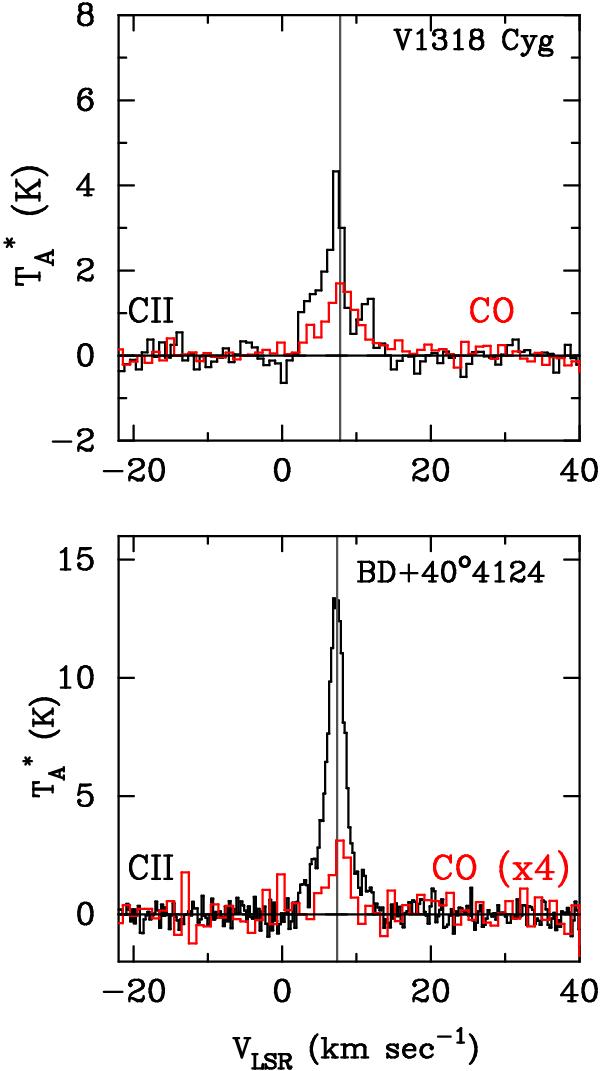
Deep [C ii] and CO J = 13 → 12 spectra toward BD+40°4124 and V 1318 Cyg. [C ii] is plotted in black and the CO line profiles in red. For BD+40°4124, where the CO J = 13 → 12 line is quite faint, we multiplied the spectrum with a factor of four. The systemic velocity is marked by a vertical gray line.
Current usage metrics show cumulative count of Article Views (full-text article views including HTML views, PDF and ePub downloads, according to the available data) and Abstracts Views on Vision4Press platform.
Data correspond to usage on the plateform after 2015. The current usage metrics is available 48-96 hours after online publication and is updated daily on week days.
Initial download of the metrics may take a while.